filmov
tv
MATLAB AppDesigner | Tutorial 15 | Reading and Plotting Data from Excel

Показать описание
☑️ In this video:
0:37 Reading excel data in
1:42 Adding an axes for plotting
2:27 Defining the variable to plot the graph
4:09 Table to array function
4:34 Plotting the graph
5:20 Adding a grid to the plot
▶️ If you are finding my videos helpful please leave a like and subscribe to my channel.
⏭️ In the upcoming videos I'll teach how to use all the components in components library and how to connect AppDesigner to Simulink.
✉️ Get in touch:
If you do need some one to one support, feel free to drop an email via my contact page on my website. I will try my best to get back to you.
Thanks for watching everyone!
 0:08:05
MATLAB AppDesigner | Tutorial 15 | Reading and Plotting Data from Excel
 0:05:56
MATLAB AppDesigner | Tutorial 10 | Startup function
 0:10:26
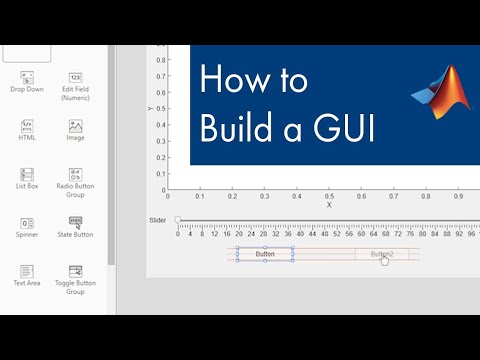
How to Build a GUI in MATLAB using App Designer
 0:07:17
MATLAB AppDesigner | Tutorial 1 | Getting Started and Hello World app
 0:04:03
App designer : A complete course on app designer MATLAB
 0:08:08
MATLAB AppDesigner | Tutorial 14 | Reading Data from Excel to Table
 0:08:26
MATLAB AppDesigner | Tutorial 5 | Lamp & Label warning using switch statement
 0:04:50
Getting Started with App Designer
 0:05:45
MATLAB AppDesigner | Tutorial 3 | How to compile/package an app
 0:00:54
How to Access Website Link or Hyperlink Using | App Designer MATLAB
 0:42:28
Program dan Aplikasi Komputer - TUTORIAL MATLAB 6 - App Design
 0:09:52
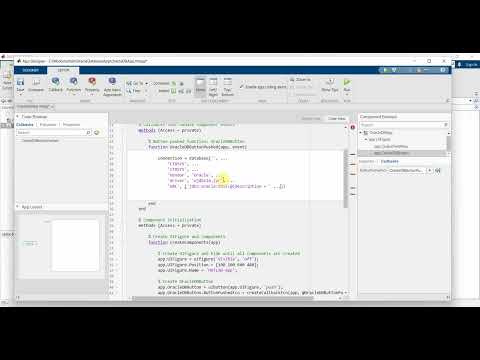
How to connect and work with Oracle database in matlab using App Designer?
 1:20:41
MATLAB App Designer
 0:03:10
Percentage Error | App Designer MATLAB
 0:00:16
fifteen | MATLAB Hacks
 0:17:35
MATLAB Programming Tutorial #15 Applications of Integration Formulae
 0:04:43
MATLAB AppDesigner | Tutorial 9 | Plotting a graph using axes
 0:08:35
MATLAB AppDesigner | Tutorial 16 | Adding rows and columns to tables
 0:00:38
Choose from 15,000,000 Colors in MATLAB #shorts
 0:00:44
Use MATLAB to Solar Power Up your House #Shorts
 0:01:01
Butterfly Equation and Animation #maths #coding #python #matlab #shorts #shortvideo
 0:01:39
MATLAB App Designer 6-9
 0:00:52
MATLAB: developing a tip calculator
 0:06:04
Sum Calculator App in Matlab | Callback functions| Matlab App Designer
Комментарии