filmov
tv
MATLAB AppDesigner | Tutorial 9 | Plotting a graph using axes

Показать описание
☑️ In this video:
0:06 Introduction
0:14 Starting the app development adding axes
1:18 Call back function for plotting graph y = sin(x)
2:55 Completed up
3:13 Changing plot appearance
3:48 What's in the next tutorial?
▶️ If you are finding my videos helpful please leave a like and subscribe to my channel.
⏭️ In the upcoming videos I'll teach how to use all the components in components library and how to connect AppDesigner to Simulink.
✉️ Get in touch:
If you do need some one to one support, feel free to drop an email via my contact page on my website. I will try my best to get back to you.
Thanks for watching everyone!
 0:04:43
MATLAB AppDesigner | Tutorial 9 | Plotting a graph using axes
 0:05:19
MatLab AppDesigner (Tutorial 9)
 0:04:50
Getting Started with App Designer
 0:10:26
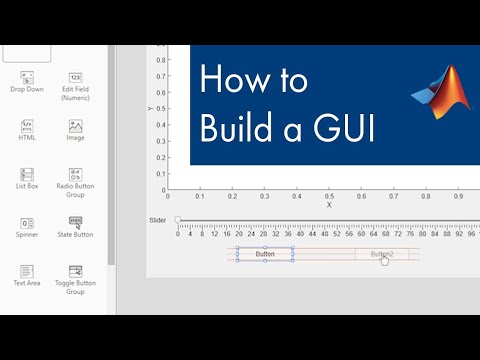
How to Build a GUI in MATLAB using App Designer
 0:05:56
MATLAB AppDesigner | Tutorial 10 | Startup function
 0:07:17
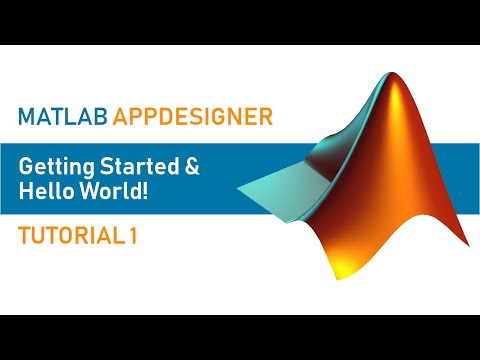
MATLAB AppDesigner | Tutorial 1 | Getting Started and Hello World app
 1:14:08
MATLAB Lecture#9 App Part 1
 0:05:45
MATLAB AppDesigner | Tutorial 3 | How to compile/package an app
 0:01:39
MATLAB App Designer 6-9
 0:00:17
Instead of Input, Use Inpudlg | MATLAB #shorts
 0:06:21
Introduction to Matlab App Designer | How to design App/GUI in Matlab | Plotting in Axes
 0:00:38
Choose from 15,000,000 Colors in MATLAB #shorts
 0:08:29
Intro to App Designer - MATLAB
 0:04:36
GUIDE to App Designer in 60 Seconds
 1:12:32
MATLAB Lecture#9 App Part 2
 0:03:21
Create Music signal plot GUI | MATLAB App Designer - (MATLAB full course)
 1:20:41
MATLAB App Designer
 0:00:54
Vibrating string with 1D wave equation in MATLAB – Part 2 #shorts
 0:03:05
A SIMPLE GUI IN MATLAB | APP DESIGNER | SIMPLE CALCULATOR | MATLAB 2018
 0:06:01
MATLAB AppDesigner | Tutorial 11 | Helper functions
 0:00:39
Matlab App Designer zoom problems
 0:05:03
MATLAB App Designer|Using Lamp and Switch in MATLAB APP Designer|URDU/HINDI
 0:03:36
Matlab App Designer - Create simple Apps in few Minutes #1
 0:03:13
New Ways to Work in Simulink, Part 9: Manage Design Data
Комментарии