filmov
tv
Easy Regression plots in R programming: How to write regression equation on Scatter Plots?

Показать описание
Dive into the world of data visualization with this comprehensive R programming tutorial! Learn how to create insightful scatter plots with regression lines using the ggplot2 package. We'll cover data preparation, plotting, and even add regression equations for a deeper understanding. Whether you're a beginner or looking to enhance your R skills, this tutorial has you covered. Subscribe for more R programming content and enhance your data analysis skills today!
🔗Code used in this video is given below the description
📌 Topics Covered:
1. Loading necessary libraries
2. Structuring and preparing your data
3. Creating a scatter plot with ggplot2
4. Adding a linear regression line with geom_smooth
5. Displaying the regression equation with stat_regline_equation
6. Enhancing your plot with ggpubr and theming
🚀 Ready to elevate your R programming skills? Hit the like button, subscribe, and ring the bell to stay updated on our latest tutorials! Share your thoughts in the comments below and let's explore the fascinating world of data visualization together.
#DataVisualization #RProgramming #DataAnalysis #Statistics #ScatterPlots #RegressionAnalysis #ggplot2 #DataScience #CodingTutorial #LearnR #DataViz #ProgrammingTips"
# How to plot residuals of linear regression
# Load necessary libraries
library(ggplot2)
library(tibble)
library(tidyr)
library(ggpubr)
# Create a data frame with concentration (conc) and optical density (OD) values for three replicates
df = tribble(~conc, ~rep1, ~rep2, ~rep3,
0, 0.00, 0.00, 0.00,
10, 0.05, 0.03, 0.05,
20, 0.10, 0.13, 0.11,
30, 0.17, 0.15, 0.15,
40, 0.23, 0.23, 0.22,
50, 0.28, 0.29, 0.27,
60, 0.41, 0.46, 0.39,
70, 0.50, 0.49, 0.45,
80, 0.53, 0.54, 0.53,
90, 0.64, 0.65, 0.60,
100, 0.74, 0.69, 0.73)
df= pivot_longer(df, cols = 2:4, names_to = "replicate", values_to = "OD")
# Create a scatter plot with a linear regression line and regression equation
ggplot(df, aes(conc, OD)) +
geom_point() + # Add points to the plot
geom_smooth(method = "lm") + # Add a linear regression line
theme_classic()
?stat_regline_equation # to get help for regline equation
------ Code ends here
Facebook page:
Mail Id:
youtube playlist:
 0:12:06
Linear Regression Plots in R
 0:05:38
Simple Linear Regression in R | R Tutorial 5.1 | MarinStatsLectures
 0:05:01
Linear Regression in R, Step by Step
 0:20:01
Linear regression using R programming
 0:05:00
Scatterplots and Regression Lines in R
 0:02:34
Linear Regression in 2 minutes
 0:10:07
Simple linear regression in R
 0:07:43
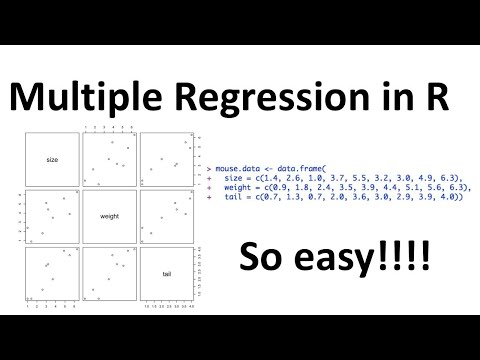
Multiple Regression in R, Step by Step!!!
 0:22:51
Questionnaire design validation analysis interpretation and report
 0:09:09
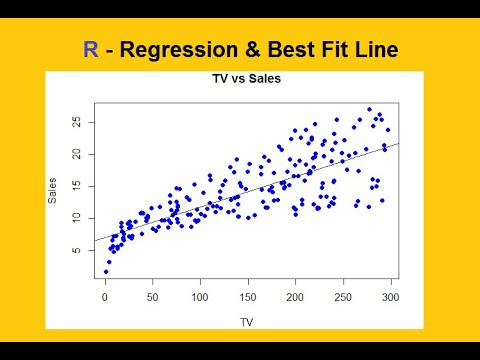
Simple Linear Regression in R - Linear Regression in R Studio with Example
 0:01:06
R Studio: How to create scatterplots with a regression line (in less than a minute)?
 0:15:00
Scatterplots and regression lines in R
 0:10:05
Linear Regression Summary in R
 0:04:14
How to plot a linear regression model with ggplot in RStudio - R for Data Science
 0:07:39
How to make a scatter plot in R with Regression Line (ggplot2)
 0:08:04
Simple Linear Regression: Checking Assumptions with Residual Plots
 1:03:44
Visualizing Regression Models in R
 0:26:51
ggplot for plots and graphs. An introduction to data visualization using R programming
 0:27:27
Linear Regression, Clearly Explained!!!
 0:05:25
Multiple Regression, Clearly Explained!!!
 0:40:25
Learn Statistical Regression in 40 mins! My best video ever. Legit.
 0:12:40
Regression: Crash Course Statistics #32
 0:06:18
Add Polynomial Regression Line to Plot in R (2 Examples) | Base R & ggplot2 | lm() & stat_sm...
 0:17:15
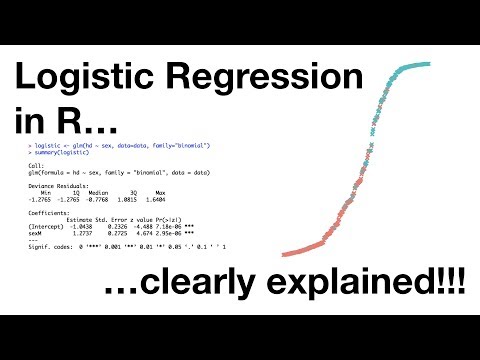
Logistic Regression in R, Clearly Explained!!!!
Комментарии