filmov
tv
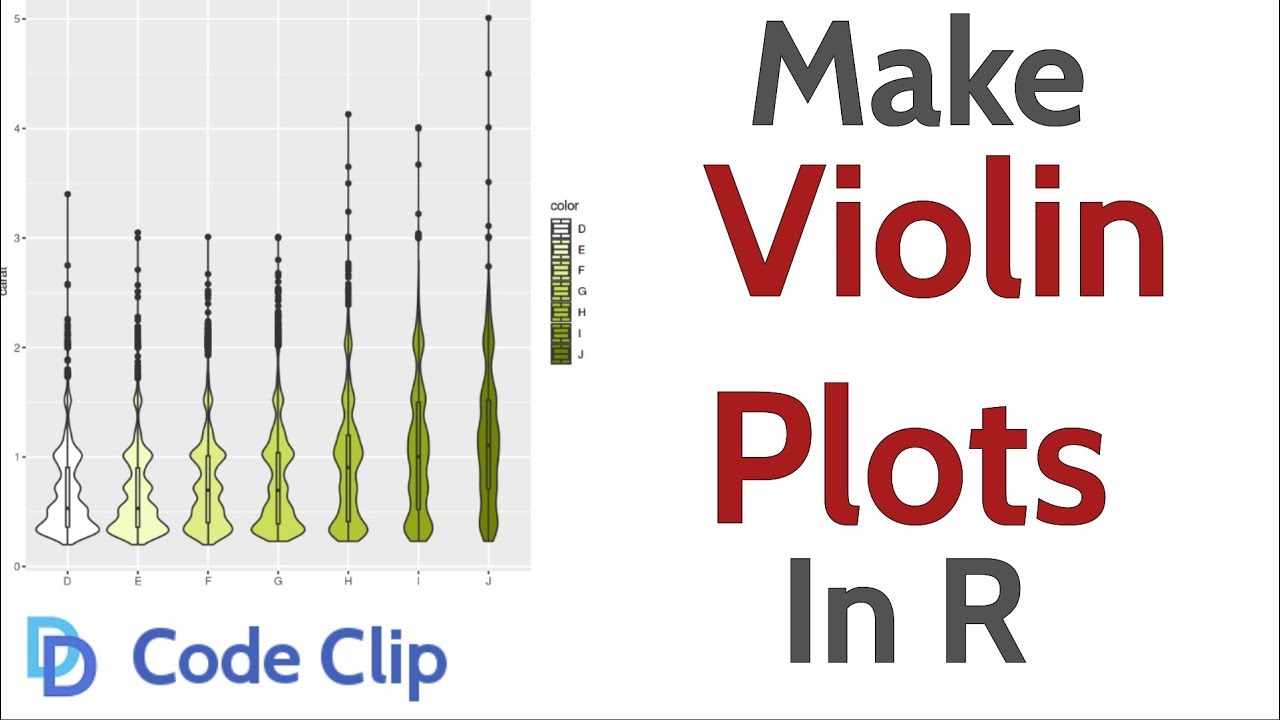
How to Make Violin Plots in R
Показать описание
Violin plots are a hybrid of density plots and box plots that can help you get a sense of the distribution of variables.
#ggplot2 #datavizualization #rprogramming
Code used in this code clip:
library(tidyverse)
library(plotly)
library(IRdisplay)
data <- diamonds
colors <- c("#FFFFFF","#F5FCC2","#E0ED87","#CCDE57",
"#B3C732","#94A813","#718200")
# Violin plot with ggplot2
data %>% ggplot(aes(x="", y = carat)) +
geom_violin() +
geom_boxplot(width=0.1) +
# Side by side violin plot with ggplot2
data %>% ggplot(aes(x=color, y = carat, fill = color)) +
geom_violin(draw_quantiles = TRUE) +
geom_boxplot(width = 0.05) +
scale_fill_manual(values = colors)
# Violin plot with plotly
p <- data %>% plot_ly(x = "", y = ~carat, type = 'violin',
box = list(visible = TRUE, width = 0.2))
# Code for creating the plot outside a notebook environment with a plotly account:
# chart_link <- api_create(p, filename="violin_test")
# chart_link
Code Clips are basic code explanations in 3 minutes or less. They are intended to be short reference guides that provide quick breakdowns and copy/paste access to code needed to accomplish common data science tasks. Think Stack Overflow with a video explanation.
* Note: YouTube does not allow greater than or less than symbols in the text description, so the code above may not be exactly the same as the code shown in the video! For R that means I may use = for assignment and the special Unicode large < and > symbols in place of the standard sized ones for dplyr pipes and comparisons. These special symbols should work as expected for R code on Windows, but may need to be replaced with standard greater than and less than symbols for other operating systems.
 0:03:45
Violin Plot [Simply explained]
 0:03:03
How to Make Violin Plots in R
 0:06:34
How to make Violin plot #violin
 0:03:17
Violin Plot
 0:04:41
How to interpret and create violin plots
 0:02:28
How to Create Violin Plots in R
 0:09:55
EASY violin plots and boxplots - simple explanation with examples
 0:11:04
What is a violin plot and how to make a Seaborn violinplot in Python
 0:42:15
violin plots should not exist
 0:15:17
How to make violin distribution plots in RStudio with vioplot
 0:04:31
How to Draw A Violin Plot in Past Statistical Software
 0:09:44
How To Create A Violin Plot in GraphPad Prism
 0:08:55
How to prepare Violin plot using GraphPad Prism with interpretation?
 0:09:51
Understanding Violin Plots
 0:18:29
How to create a violin plot with ggplot2 in R with geom_violin and geom_dotplot (CC092)
 0:08:34
What is a Violin Plot and How to Make a Matplotlib Violinplot in Python
 0:21:31
Easy Steps to Create Box Plot & Violin Chart in Excel
 0:03:24
Python Data Visualization | How to create Violin Plots | Violin Plots Interpretation | Seaborn
 0:06:06
Violin plot in SPSS
 0:12:26
Violin Plot - How to Create Violin Plot Matplotlib in Python
 0:16:28
Violin Plots in Excel (without plug-ins...) | LAMBDA(), BYROW(), and Kernel Density Estimation
 0:04:23
Plotting for Data Analysis - Box Plot and Violin Plot (2022)
 0:02:42
How to Create a Violin Plot in R. [HD]
 0:11:38
Seaborn Tutorial - Part 10: CATPLOT: Violin Plots
Комментарии