filmov
tv
Graphing a Sine Function Using a Different Period

Показать описание
👉 Learn how to graph a sine function. To graph a sine function, we first determine the amplitude (the maximum point on the graph), the period (the distance/time for a complete oscillation), the phase shift (the horizontal shift from the parent function), the vertical shift (the vertical shift from the parent function) and the x-scale (the distance between the turns and the x-intercepts). After we have obtained these features, we plot the points on the graph and graph accordingly.
Organized Videos:
✅ How to Graph Trigonometric Functions
✅ How to Graph Tangent | Learn About
✅ How to Graph Secant | Learn About
✅ How to Graph Sine and Cosine | Learn About
✅ How to Graph Trigonometric Functions | Learn About
✅ How to Graph The Sine Function
✅ How to Graph The Cosine Function
✅ How to Graph The Tangent Function
✅ How to Graph The Cotangent Function
✅ How to Graph Cosecant Function
✅ How to Graph The Secant Function
Connect with me:
#trig #graphing #brianmclogan
 0:00:27
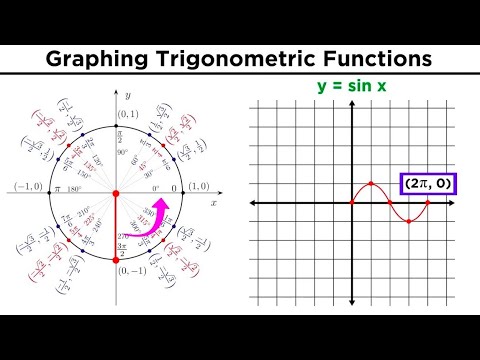
Sine Curve and the Unit Circle
 0:22:37
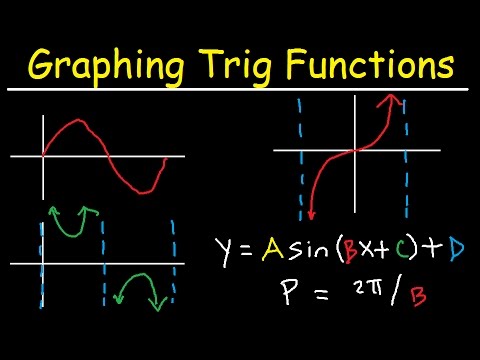
How To Graph Trigonometric Functions | Trigonometry
 0:14:07
Graphing Sine and Cosine Functions with Transformations (Multiple Examples)
 0:08:05
How to Graph the Sine Function by Applying a Phase Shift and Vertical Translation
 0:13:01
How to Graph a Sine Function - Step-By-Step Approach
 0:11:40
Graphing Trigonometric Functions
 0:01:12
Visualizing Trigonometry: Sine Function
 0:03:43
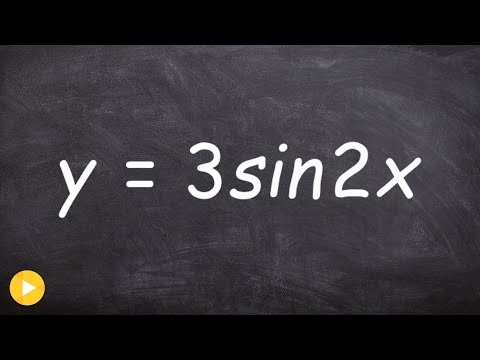
Graphing a Sine Function by Finding the Amplitude and Period
 0:00:58
Total Area versus Net Area (calculus concept)
 0:43:05
Graphing the Sine & Cosine Functions - [2-21-8]
 0:07:40
Graphing a Sine Function Using a Different Period
 0:12:00
Graphing Sin and Cos
 0:05:22
Determining the equation of a trig function | Graphs of trig functions | Trigonometry | Khan Academy
 0:10:38
Graphing Trigonometric Functions (Example: y = 3cos(x) - 2)
 0:08:44
How to Graph the Cosine Graph with Multiple Transformations
 0:01:38
Graphing the sine and cosine functions
 0:07:16
Graphing the Sine Function (using degrees)
 1:07:58
Graphing Trigonometric Functions, Phase Shift, Period, Transformations, Tangent, Cosecant, Cosine
 0:07:07
Graphing the Sine Function with a Vertical Shift
 0:04:22
Graphing a Sine Function with a Different Period
 0:01:00
Graphing the Sine Function #precalculus #trigonometry #mathematics #math
 0:07:24
Determining the Equation of a Sine and Cosine Graph
 0:04:14
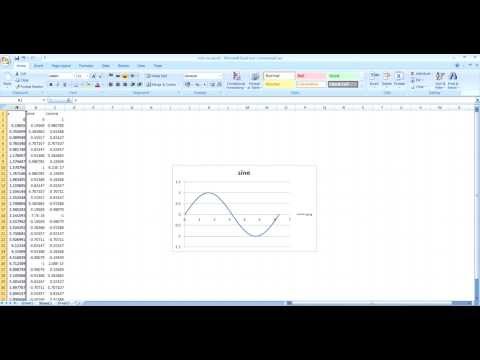
How To Draw Sine and Cosine Graphs in Excel Tutorial
 0:17:03
Graphing Sine and Cosine Using a Table and Transformations
Комментарии