filmov
tv
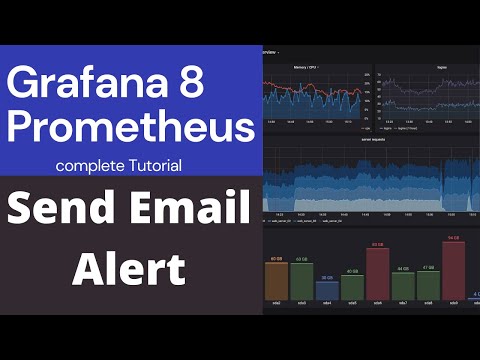
Grafana Alerts with Prometheus and Node Exporter Metrics - Introduction

Показать описание
Alerting is a critically important activity in the DevOps lifecycle. In this video I show you how to create a basic Grafana Alert using the legacy Grafana alerting system.
I am using node exporter on a cluster of Raspberry Pi's and Prometheus to scrape the metrics endpoints.
I walk you through the process of creating a Slack App that Grafana can use to send an alert message to a dedicated alerts channel.
After creating the Slack App, we create an Alert based off a Disk Usage metric (the percentage of disk space used on the Raspberry Pi).
Timestamps:
Introduction: 00:00
Slack App Creation: 00:40
Notification Channel Creation: 04:01
Alert Creation: 05:36
Alert Testing: 15:26
Grafana 8 Alerts and Conclusion: 16:50
 0:03:47
How to create an alert in Grafana
 0:18:55
Grafana Alerts with Prometheus and Node Exporter Metrics - Introduction
 0:06:27
Alerting in Grafana 9
 0:08:34
Grafana Email Alerts
 0:31:48
Project 5: Setup Monitoring and Alerting on Kubernetes | Prometheus and Grafana Tutorial
 0:15:21
Grafana – установка, как настроить алерты, как интегрировать Prometheus и ClickHouse – VyacheArt...
 0:24:36
Server Monitoring // Prometheus and Grafana Tutorial
 0:54:47
Prometheus, Alert Manager, Email Notification & Grafana in Kubernetes Monitoring | Merciboi
 0:00:37
How Prometheus and Grafana works? #devops #monitoring
 0:21:31
How Prometheus Monitoring works | Prometheus Architecture explained
 0:03:17
Learn Grafana 8 and Prometheus - Grafana and Microsoft Teams Notification Alert - Lesson 13
 0:09:15
Prometheus Tutorial | Prometheus Server Down Alert | Prometheus Alert Manager
 0:13:56
Monitoring Your Kubernetes Cluster with Grafana, Prometheus, and Alertmanager
 0:13:37
Introduction to Alert Manager for Prometheus on Kubernetes
 0:06:06
Настраиваем алерты и уведомления в Grafana | Telegram | Настройка правил | UnixHost...
 0:10:43
Don't Make These 6 Prometheus Monitoring Mistakes | Prometheus Best Practices & Pitfalls
 0:31:50
How to send Alerts in Prometheus - Alertmanager
 0:10:55
Session 3 (Monitoring) : Alerting configuration through Prometheus and Grafana
 0:04:23
Learn Grafana 8 and Prometheus - send telegram alert - Lesson 16
 0:33:30
MINECRAFT MONITORING AND ALERTING WITH PROMETHEUS AND GRAFANA | RUNNING MINECRAFT IN PRODUCTION PT 3
 0:22:13
Prometheus + SQL Exporter | Setup of Prometheus and Grafana Alerts for monitoring
 0:18:35
How to configure Prometheus alertmanager to fire slack alert notification | Prometheus tutorial
 0:06:40
Grafana Variables and Templates with Prometheus 📊 | Introduction
 0:19:22
What we Learned Integrating Grafana with Prometheus
Комментарии