filmov
tv
R tutorial - Using Factors in R
Показать описание
In this introduction to R course you will learn about the basics of R, as well as the most common data structures it uses to store data
If you have some background in statistics, you'll have heard about categorical variables. Unlike numerical variables, categorical variables can only take on a limited number of different values. Otherwise put, a categorical variable can only belong to a limited number of categories. As R is a statistical programming language, it's not a surprise that there exists a specific data structure for this: factors. If you store categorical data as factors, you can rest assured that all the statistical modelling techniques will handle such data correctly.
A good example of a categorical variable is a person's blood type: it can be A, B, AB or O. Suppose we have asked 8 people what their bloodtype is and recorded the information as a vector `blood`.
Now, for R it is not yet clear that you're dealing with categorical variables, or factors, here. To convert this vector to a factor, you can use the `factor()` function.
The printout looks somewhat different than the original one: there are no double quotes anymore and also the factor levels, corresponding to the different categories, are printed. R basically does two things when you call the factor function on a character vector: first of all, it scans through the vector to see the different categories that are in there. In this case, that's "A", "AB", "B" and "O". Notice here that R sorts the levels alphabetically. Next, it converts the character vector, blood in this example, to a vector of integer values. These integers correspond to a set of character values to use when the factor is displayed. Inspecting the structure reveals this:
We're dealing with a factor with 4 levels. The "A"'s are encoded as 1, because it's the first level, "AB" is encoded as 2, "B" as 3 and "O" as 4. Why this conversion? Well, it can be that your categories are very long character strings. Each time repeating this string per observation can take up a lot of memory. By using this simple encoding, much less space is necessary. Just remember that factors are actually integer vectors, where each integer corresponds to a category, or a level.
As I said before, R automatically infers the factor levels from the vector you pass it and orders them alphabetically. If you want a different order in the levels, you can specify the levels argument in the factor function.
If you compare the structures of `blood_factor` and `blood_factor2`, you'll see that the encoding is different now.
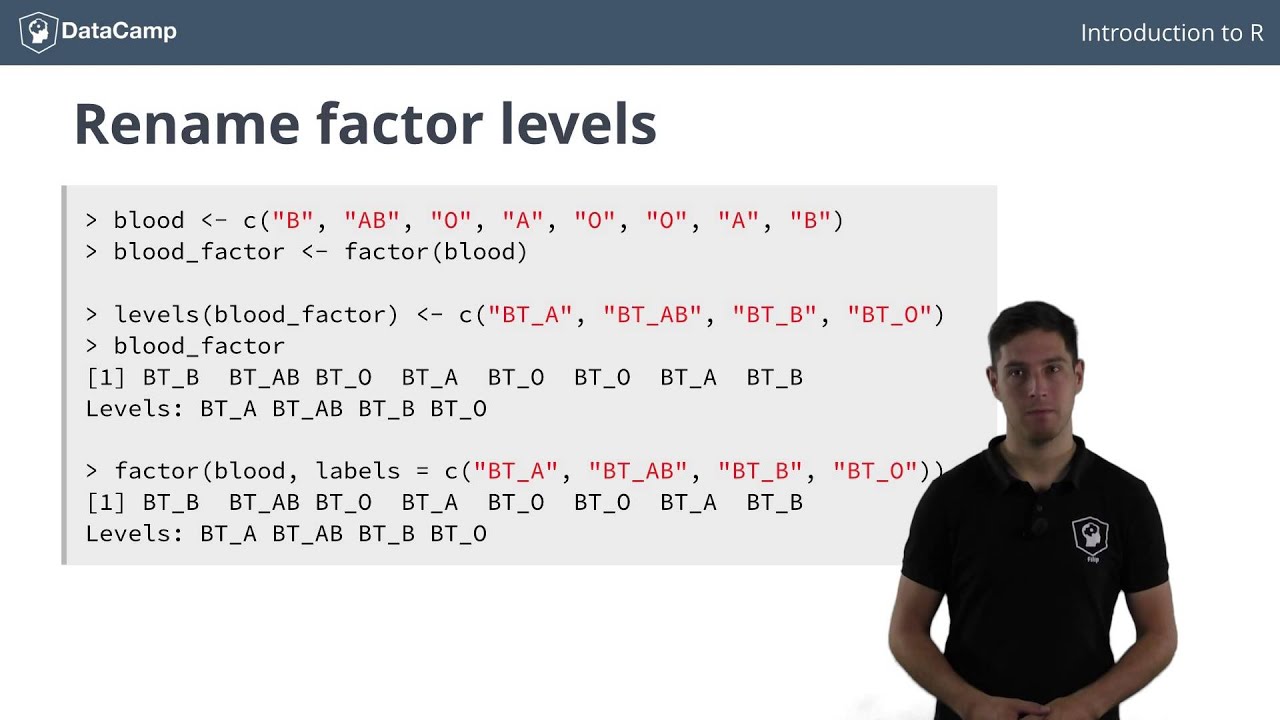
Next to changing the order of the levels, it is possible to manually specify the level names, instead of letting R choose them. Suppose that for clarity, you want to display the blood types as `BT_A`, `BT_AB`, `BT_B` and `BT_O`. To name the factor afterwards, you can use the `levels()` function. Similar to the names function to name vectors, you can pass a vector to levels blood_factor.
You can also specify the category names, or levels, by specifying the `labels` argument in `factor()`.
I admit it, it's a bit confusing. For both of these approaches, it's important to follow the same order as the order of the factor levels: first A, then AB, then B and then O. But this can be pretty dangerous: you might have mistakenly changed the order.
To solve this, you can use a combination of manually specifying the `levels` and the `labels` argument when creating a factor. With `levels`, you specify the order, just like before, while with the labels, you specify a new name for the categories:
In the world of categorical variables, there's also a difference between nominal categorical variables and ordinal categorical variables. The nominal categorical variables has no implied order. For example, you can't really say the the blood type "O" is greater or less than the blood type "A". "O" is not worth more than "A" in any sense I can think of. Trying such a comparison with factors will generate a warning, telling you that less than is not meaningful:
However, there are examples for which such a natural ordering does exist. Consider for example this tshirt vector. It has codes ranging from from small to large. Here, you could say that extra large indeed is greater than, say, a small, right?
Of course, R provides a way to impose this kind of order on a factor, thus making it an ordered factor. Inside the factor() function, you simply set the argument ordered to TRUE, and specify the levels in ascending order.
Can you so how these less then signs appear between the different factor levels? This compactly shows that we're dealing with an ordered factor now. If we now try to perform a comparison, this call for example, ..., evaluates to TRUE, without a warning message, because a medium was specified to be less than a large.
If you have some background in statistics, you'll have heard about categorical variables. Unlike numerical variables, categorical variables can only take on a limited number of different values. Otherwise put, a categorical variable can only belong to a limited number of categories. As R is a statistical programming language, it's not a surprise that there exists a specific data structure for this: factors. If you store categorical data as factors, you can rest assured that all the statistical modelling techniques will handle such data correctly.
A good example of a categorical variable is a person's blood type: it can be A, B, AB or O. Suppose we have asked 8 people what their bloodtype is and recorded the information as a vector `blood`.
Now, for R it is not yet clear that you're dealing with categorical variables, or factors, here. To convert this vector to a factor, you can use the `factor()` function.
The printout looks somewhat different than the original one: there are no double quotes anymore and also the factor levels, corresponding to the different categories, are printed. R basically does two things when you call the factor function on a character vector: first of all, it scans through the vector to see the different categories that are in there. In this case, that's "A", "AB", "B" and "O". Notice here that R sorts the levels alphabetically. Next, it converts the character vector, blood in this example, to a vector of integer values. These integers correspond to a set of character values to use when the factor is displayed. Inspecting the structure reveals this:
We're dealing with a factor with 4 levels. The "A"'s are encoded as 1, because it's the first level, "AB" is encoded as 2, "B" as 3 and "O" as 4. Why this conversion? Well, it can be that your categories are very long character strings. Each time repeating this string per observation can take up a lot of memory. By using this simple encoding, much less space is necessary. Just remember that factors are actually integer vectors, where each integer corresponds to a category, or a level.
As I said before, R automatically infers the factor levels from the vector you pass it and orders them alphabetically. If you want a different order in the levels, you can specify the levels argument in the factor function.
If you compare the structures of `blood_factor` and `blood_factor2`, you'll see that the encoding is different now.
Next to changing the order of the levels, it is possible to manually specify the level names, instead of letting R choose them. Suppose that for clarity, you want to display the blood types as `BT_A`, `BT_AB`, `BT_B` and `BT_O`. To name the factor afterwards, you can use the `levels()` function. Similar to the names function to name vectors, you can pass a vector to levels blood_factor.
You can also specify the category names, or levels, by specifying the `labels` argument in `factor()`.
I admit it, it's a bit confusing. For both of these approaches, it's important to follow the same order as the order of the factor levels: first A, then AB, then B and then O. But this can be pretty dangerous: you might have mistakenly changed the order.
To solve this, you can use a combination of manually specifying the `levels` and the `labels` argument when creating a factor. With `levels`, you specify the order, just like before, while with the labels, you specify a new name for the categories:
In the world of categorical variables, there's also a difference between nominal categorical variables and ordinal categorical variables. The nominal categorical variables has no implied order. For example, you can't really say the the blood type "O" is greater or less than the blood type "A". "O" is not worth more than "A" in any sense I can think of. Trying such a comparison with factors will generate a warning, telling you that less than is not meaningful:
However, there are examples for which such a natural ordering does exist. Consider for example this tshirt vector. It has codes ranging from from small to large. Here, you could say that extra large indeed is greater than, say, a small, right?
Of course, R provides a way to impose this kind of order on a factor, thus making it an ordered factor. Inside the factor() function, you simply set the argument ordered to TRUE, and specify the levels in ascending order.
Can you so how these less then signs appear between the different factor levels? This compactly shows that we're dealing with an ordered factor now. If we now try to perform a comparison, this call for example, ..., evaluates to TRUE, without a warning message, because a medium was specified to be less than a large.
 0:05:40
R tutorial - Using Factors in R
 0:05:42
Including Variables/ Factors in Regression with R, Part I | R Tutorial 5.7 | MarinStatsLectures
 0:04:01
R Tutorial: Exploring categorical data
 2:10:39
R Programming Tutorial - Learn the Basics of Statistical Computing
 0:03:16
R Tutorial | Create factors with levels in r | factor() in r example
 0:08:10
Working with Variables and Data in R | R Tutorial 1.8 | MarinStatslectures
 0:09:49
R Tutorial: Exploratory Factor Analysis (EFA)
 0:06:31
Including Variables/ Factors in Regression with R, Part II | R Tutorial 5.8 | MarinStatsLectures
 0:05:24
R Tutorial - Using the Data Frame in R
 0:22:27
PCA tutorial with R (Factoshiny & FactoMineR)
 0:04:13
R Tutorial: Data Manipulation with data.table in R | Intro
 0:12:46
R tutorial: Confirmatory factor analysis (CFA)
 0:08:56
ANOVA (Analysis of variance) simply explained
 0:22:00
Complete Factors in R Programming (Theoretical & Practical) | R Programming Tutorial #25
 0:04:47
R Tutorial: Parallel Analysis
 0:03:34
RStudio Factor Command Tutorial
 0:49:45
R Programming for Beginners | Complete Tutorial | R & RStudio
 6:49:39
R Tutorial For Beginners 2022 | R Programming Full Course In 7 Hours | R Tutorial | Simplilearn
 0:07:32
Box Plots with Two Factors (Stratified Boxplots) in R | R Tutorial 2.3 | MarinStatsLectures
 0:07:09
R Tutorial: Labelling factors (and renaming string variables)
 0:10:53
Perform social network analysis in R Tutorial
 0:59:48
R programming in one hour - a crash course for beginners
 0:14:37
A tutorial for writing functions in R (CC177)
 0:06:52
Odds Ratio, Relative Risk & Risk Difference with R | R Tutorial 4.11| MarinStatsLectures
Комментарии