filmov
tv
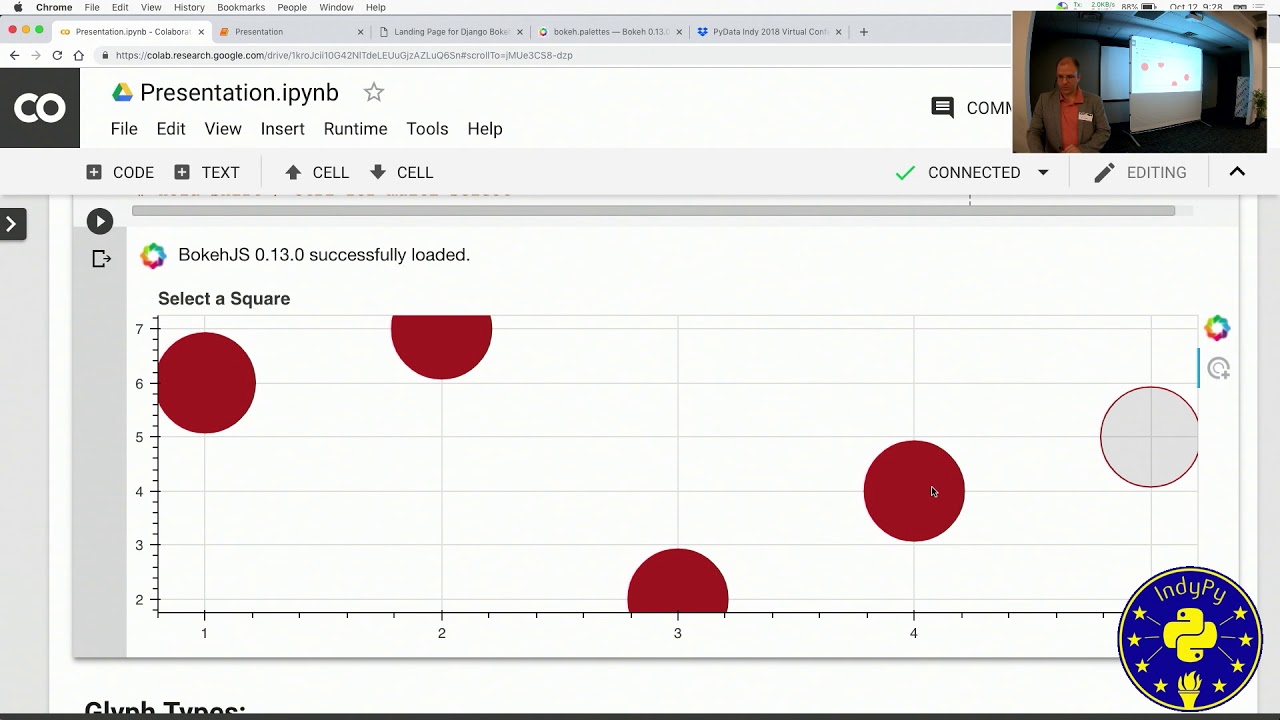
'Data Visualization with Bokeh' by James Alexander
Показать описание
Recorded at: Launch Fishers in Fishers, IN on 10/12/18
PyData Indy 2018
Learn how to create interactive charts and graphs without writing any JavaScript. We'll use Python to generate simple interactive graphs and plots within Jupyter notebooks, and embedded in a running Django site. I'll show examples of streaming data to a Bokeh instance, and interactively intuit about a large dataset using Datashader.
 0:33:54
 0:19:10
 0:54:50
 0:07:27
 0:29:17
 0:10:40
 0:00:10
 0:02:22
 0:01:34
 0:02:15
 0:03:33
 0:15:03
 0:01:02
 1:06:12
 0:06:33
 0:02:07
 0:29:25
 0:19:16
 0:03:39
 0:01:13
 0:08:36
 0:26:18
 3:29:37
 0:31:20