filmov
tv
Calculus 1, Lec 28A: Data Modeling of the U.S. Population with a Logistic Curve, Mean Value Theorem
Показать описание
(0:00) Lecture plan.
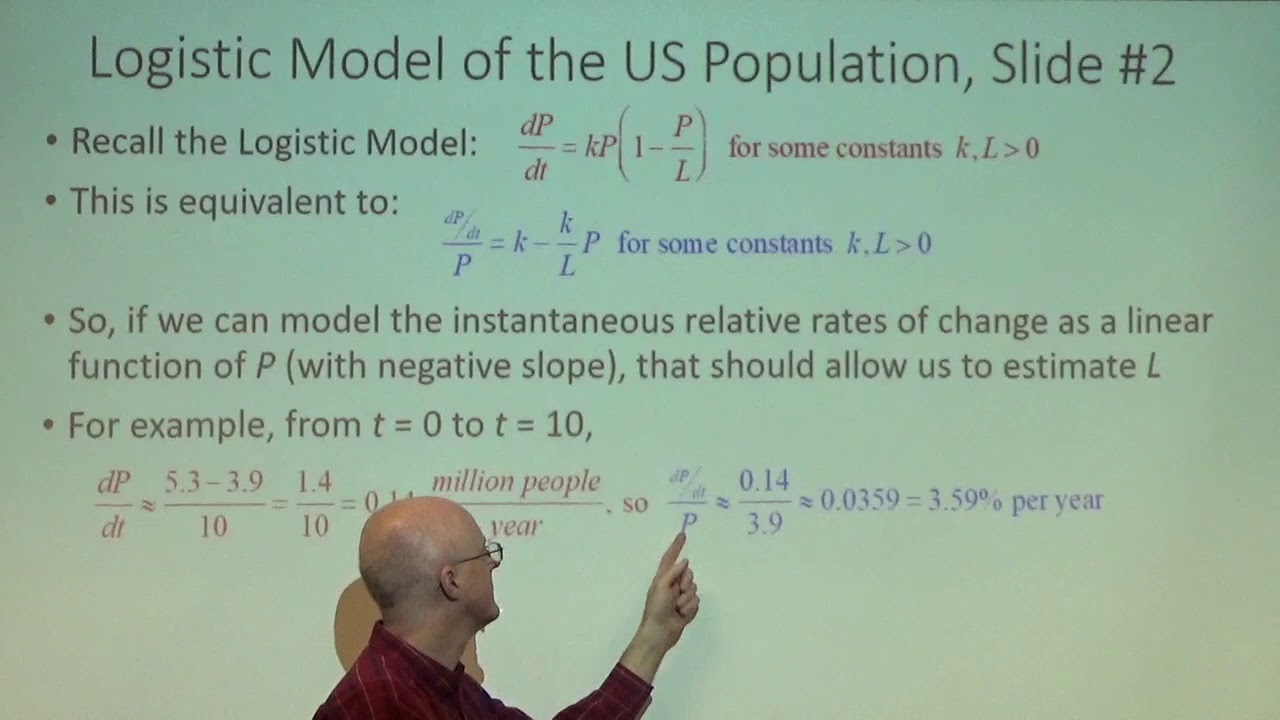
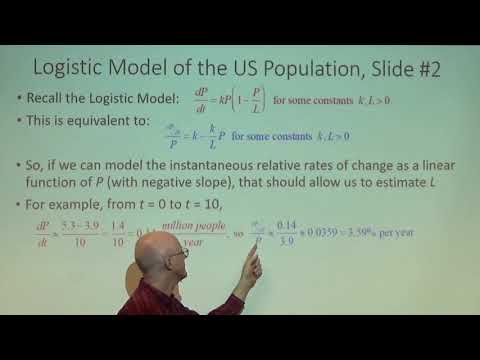
(1:25) Logistic model of the U.S. Population, starting in the year 1790 (time t = 0 years) through the year 2010 (time t = 220 years). Can we estimate the carrying capacity L? Approximate the instantaneous relative (percent) rates of change (dP/dt)/P as a linear function, with a negative slope, of the population P. Use this to estimate k and L. Then compare the graph of the data with the model. It doesn't do so well.
(13:57) Logistic model of the U.S. Population, starting in the year 1950 (time t = 0 years) through the year 2010 (time t = 70 years). This is better, though the model is still simplistic. Review what you should know about the logistic model.
(17:13) Statement of the Mean Value Theorem (MVT).
(22:05) Geometric meaning of the Mean Value Theorem.
(25:22) Example to illustrate the Mean Value Theorem.
 0:30:55
 0:22:45
 0:27:51
 0:26:14
 0:20:25
 0:13:59
 0:09:21
 0:05:51
 0:59:51
 0:33:54
 0:39:35
 0:23:51
 0:28:39
 0:38:11
 0:18:33
 0:51:14
 0:07:26
 0:52:23
 0:19:02
 0:05:23
 0:14:59
 0:23:21
 0:33:26
 0:35:13