filmov
tv
Photoelectric Effect (5 of 8) Cut-Off Frequency, An Explanation

Показать описание
An explanation of what the cut-off frequency is for the photoelectric effect. Includes a demonstration using one of the simulations from PhET simulations.The cut-off frequency is the minimum frequency of incoming light below which no photoelectrons will be emitted.
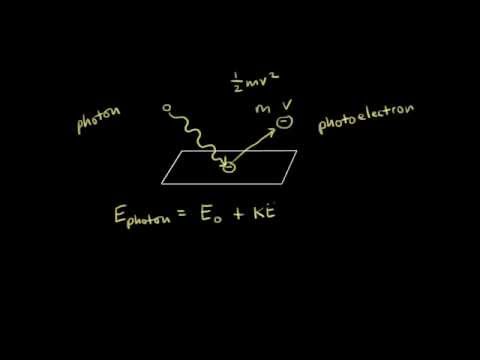
The photoelectric effect is the emission of electrons when light is shined on a material. Electrons emitted in this way can be called photoelectrons.
In 1905, Albert Einstein published a paper advancing the hypothesis that light energy is carried in discrete quantized packets to explain experimental data from the photoelectric effect. This was a key step in the development of quantum mechanics. In 1914, Millikan's experiment supported Einstein's model of the photoelectric effect. Einstein was awarded the Nobel Prize in 1921 for his discovery of the law of the photoelectric effect.
Social Media for Step by Step Science:
Support my channel by doing all of the following:
(1) Subscribe, get all my physics, chemistry and math videos
(2) Give me a thumbs up for this video
(3) Leave me a positive comment
(4) Share is Caring, sharing this video with all of your friends
 0:16:38
Photoelectric Effect (5 of 8) Cut-Off Frequency, An Explanation
 0:05:31
Quantum 101 Episode 8: Photoelectric Effect Explained
 0:20:40
CHE 1B: 8-5: photoelectric effect
 0:04:23
Photoelectric Effect Explained in Simple Words for Beginners
 0:11:30
Your Daily Equation #8: Photoelectric Effect: Einstein's Nobel Prize Discovery
 0:00:58
The Photoelectric Effect
 0:03:56
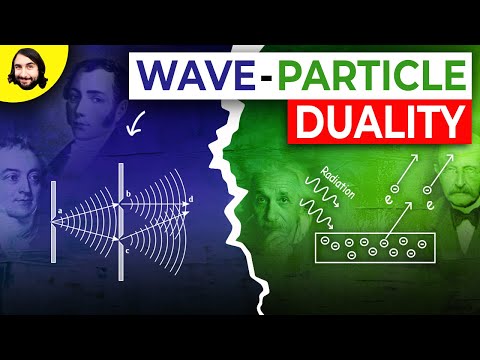
Wave-Particle Duality and the Photoelectric Effect
 0:13:59
Photoelectric Effect (6 of 8) Stopping Potential, An Explanation
 0:10:46
Photoelectric Effect | X-ray interaction with matter | X-ray physics | Radiology Physics Course #23
 0:18:52
5-8 Photoelectric Effect
 0:23:24
8 Photoelectric effect
 0:18:26
Photoelectric Effect (7 of 8) Determining Planck's Constant
 0:17:18
Photoelectric Effect (1 of 8) An Explanation (Clear and Simple)
 0:10:24
Photoelectric effect | Electronic structure of atoms | Chemistry | Khan Academy
 0:00:34
Brian Greene Explains The Photoelectric Effect
 0:00:28
Homemade Cyclotron
 0:00:19
Beauty of the Brain😍 IQ - IIT Bombay
 0:13:22
Photoelectric Effect (8 of 8) A Summary (Clear and Concise)
 0:00:17
magnetic fields lines of solenoid #shorts #class10science #scienceexperiment
 0:00:24
Isaac Newton's INSANE Sleep Habits 😬
 0:00:37
Last Words of Albert Einstein #shorts
 0:00:26
Diffraction Pattern of Light by Single Slit Using Two Blades....
 0:05:25
Photoelectric Effect (4 of 8) Example No.3
 0:00:25
Topper vs Average Student 😮 | Dr.Amir AIIMS #shorts #trending
Комментарии