filmov
tv
How to create Power BI Dashboard (Report) in 7 Minutes | @PavanLalwani

Показать описание
How to create Power BI Dashboard (Report) in 7 Minutes
In this tutorial, We're diving straight into the heart of Power BI to show you how you can swiftly create a fully functional and visually appealing report or dashboard from scratch. Perfect for beginners and those new to Power BI, this video is your first step towards becoming proficient in one of the most powerful Business Intelligence tools available today.
Here's what we'll cover:
• Introduction to Power BI: Briefly understand what Power BI is and why it's a game-changer in the world of business analytics.
• Step-by-Step Guide: Learn how to create a fully functional Power BI report from scratch in less than 7 minutes. Whether you call it a dashboard or a report, we'll show you how to bring your data to life, making it both informative and visually appealing.
• PowerPoint for Power BI: Discover how to use Microsoft PowerPoint to enhance your Power BI reports' aesthetics. In less than two minutes, we'll walk you through creating beautiful, custom visuals for your reports, making them stand out with minimal effort.
• Practical Tips and Tricks: Along the way, we'll share valuable shortcuts and tips to speed up your report creation process, including duplicating elements efficiently and customizing visuals to match your brand or project theme.
• Real-World Application: Understand how these skills apply in a professional setting, whether you're looking to impress your boss, streamline your workflow, or simply make your reports more engaging for your audience.
• By the end of this video, you'll not only have learned how to create and customize a Power BI dashboard quickly but also how to make it stand out with simple yet effective visual enhancements. Whether you're presenting to your boss, impressing a client, or just looking to learn a new skill, this tutorial is tailored to help you achieve that in record time.
So, whether you're a student, a professional, or anyone in between looking to add value to your work with quick and effective Power BI reports, join me in this tutorial and let's make data reporting simple and fun!
 0:12:32
Power BI Tutorial for Beginners
 0:23:03
Power BI Tutorial For Beginners | Create Your First Dashboard Now (Practice Files included)
 0:27:53
How to use Microsoft Power BI - Tutorial for Beginners
 0:15:10
How to create Power BI Dashboard (Report) in 7 Minutes in Power BI Desktop | @PavanLalwani
 0:41:07
How to Build Power BI Reports from Start to Finish
 0:15:25
Create your first Power BI report (2021)
 0:11:15
Your first 10 minutes of Power BI - A no-nonsense getting started tutorial for beginners
 0:06:33
Mastering Microsoft Power BI | Create Power BI Report in 5 Minutes | Tutorialspoint
 0:08:14
Power BI Tutorial For Beginners | Excel data into Power Bi | Import Excel Data to Power BI
 0:15:20
Learn Power BI in Telugu and create your first report in 15 minutes
 3:02:18
Hands-On Power BI Tutorial 📊 Beginner to Pro [Full Course] ⚡
 1:53:51
Power BI for Beginners How to Create Power BI Dashboard | Dynamic and Interactive Dashboard
 0:10:55
How To Create these useful Power Bi Visuals that Excel Lacks
 0:08:36
How to Create and Manage Relationships in Power BI | Microsoft Power BI for Beginners
 0:44:59
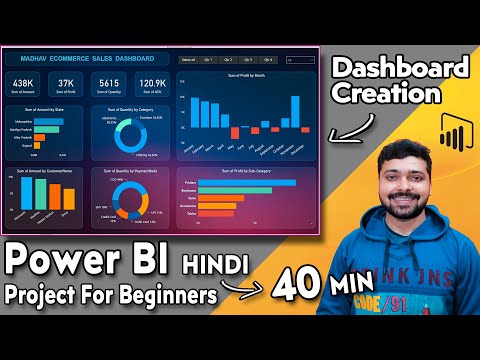
Power Bi tutorial for Beginners | Power BI Dashboard Project in Hindi | Power Bi Course 2023
 0:42:37
Full Power BI Guided Project | Microsoft Power BI for Beginners
 0:03:42
10.2 How to create an account on Power BI Service? | Power BI Tutorial for Beginners
 0:11:33
Create a Power BI Custom Visual in 10 Minutes!
 0:08:39
How to Create POWER BI Service Free Account | Power BI Tutorial
 0:44:14
Build THIS! Report DESIGN in Power BI | FULL TUTORIAL
 0:19:12
Create an Amazing Power BI Dashboard in 19 minutes | Amazon Prime Movies and TV Shows
 0:19:48
How To Create Your Perfect Power BI Template
 1:19:28
POWER BI Tutorial From BEGINNER to Pro Level - HR Power BI report - Power BI Desktop
 0:06:12
10.6 Create a Dashboard in Power BI | Power BI Tutorial for Beginners | By Pavan Lalwani
Комментарии