filmov
tv
How Nagios XI Works
Показать описание
Nagios XI provides comprehensive IT infrastructure monitoring of all mission-critical components including servers, networks, operating systems, applications, network protocols, services, and systems metrics. Hundreds of third-party add-ons enable monitoring of virtually all in-house applications, services, and systems.
Our Nagios expert, Aaron, made this series to teach users the essentials of Nagios XI so you can get monitoring straight away. Learn how Nagios XI works and how you can easily monitor anything in your environment.
Who this video is for:
You have just Nagios XI installed somewhere, somehow on your network – either on a virtual machine or on physical hardware.
You want to learn how to monitor things in your environment and actually learn how to get some things monitored.
So whether this is your first time deploying Nagios XI in your organization or it’s already running and you need to learn it – this series if for you my friend! Hit play above and learn how Nagios has your back!
Already know how XI works and are ready to start monitoring? Click here to jump into Configuration Wizards.
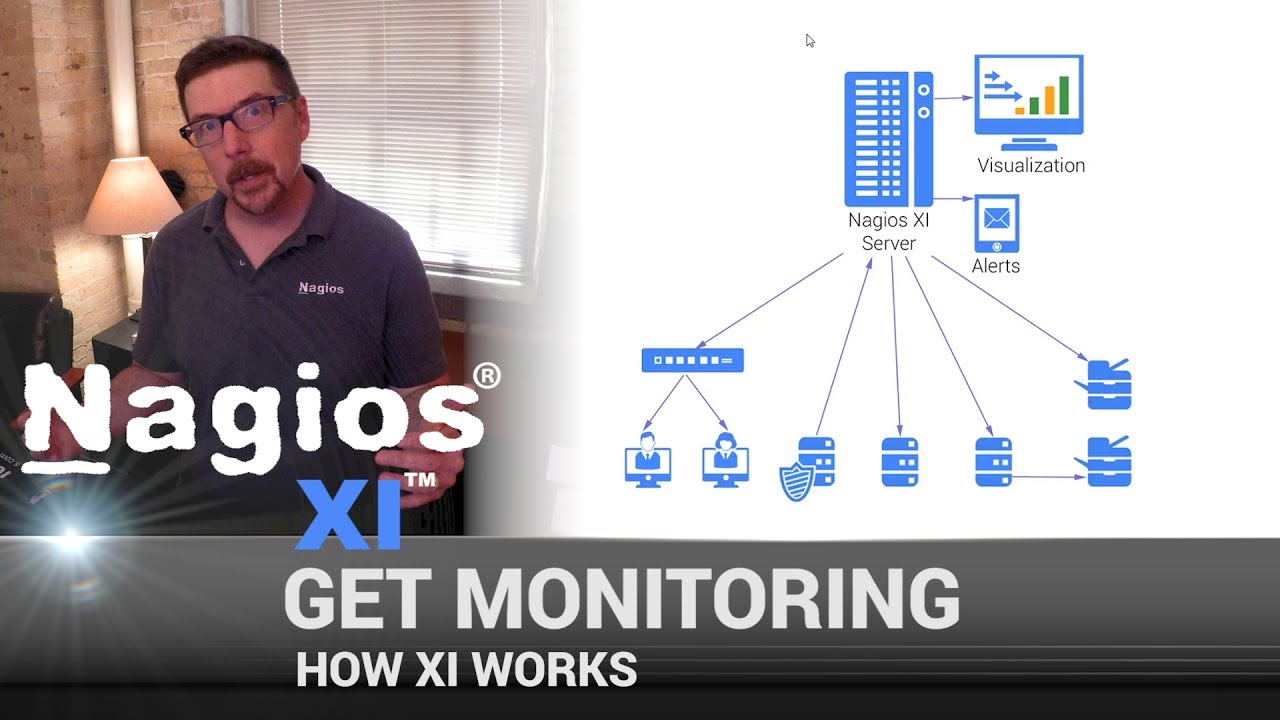
How Nagios XI Works
As you see in the diagram, a Nagios XI Server actively monitors things in the network and it does it through either of two methods:
agent
native protocol
Agent
An agent lives on a network element like a Linux server. Nagios reaches out to the agent to check various stats (e.g. drive space, RAM, CPU usage, etc.). The agent collects the requested information and responds back to Nagios XI. Nagios first stores the information for later reports, historical charts, and graphing and then the other action it can take is to generate an alert. With the alert, the stats the agent returns may be representing a drive that’s too full or some other state and the generated alert is how you will know about the potential issue. (That’s a very generalized overview of an incredibly powerful and customizable piece of software.)
Native Protocol
Another way to monitor devices is through a native protocol. There are two native protocols that Nagios uses, one is Simple Network Management Protocol (SNMP) and the other is Windows Management Instrumentation (WMI) which is specific to Windows environments. For example, if you have a network switch with SNMP enabled and configured, Nagios XI can reach out to see how the switch is doing. The switch will then respond with its state (e.g. all good, a port down, or anything else that may be going on).
The above are examples of active monitoring where Nagios asks a question and receives an answer back.
There is yet another way to monitor which is through passive monitoring. An example of passive monitoring is where the Nagios box never reaches out to devices; agents instead send a notification to Nagios – either regularly or just when a triggering event occurs.
And that’s how Nagios XI works friends!
UP NEXT: Click learn Configuration Wizards to quickly get monitoring.
Other topics in the video series include:
Configuration Wizard Templates
Bulk Host Cloning and Import Wizard
Managing Plugins
#Nagios #NetworkMonitoring #WhatIsNagios #ITprofessional
 0:05:55
How Nagios XI Works
 0:00:51
Introducing Nagios XI
 0:05:20
1. Nagios XI - Core Config Manager - How it Works
 0:16:00
How to network monitoring with Nagios XI step by step
 0:15:27
How To Install Nagios XI (Four Methods)
 0:01:45
Logging into Nagios XI
 0:15:26
How to Build Network Monitoring Tools with Nagios: Step-by-Step Guide
 0:59:18
Introduction to Nagios XI Webinar
 0:04:58
How SNMP Traps Work in Nagios XI network monitor
 0:27:29
Nagios Monitoring Tool Tutorial | Server Monitoring with Nagios | DevOps Tools | Intellipaat
 0:04:57
How to Monitoring Windows Machines using Nagios Core for free
 0:11:54
Nagios XI Jumpstart - Start Network Monitoring In Minutes
 0:03:17
Create graphs easily in Nagios XI for Network Analyzer reporting
 0:02:29
How to install Nagios XI using vSphere
 0:57:12
Overview of Nagios Solutions Webinar
 0:03:21
How to Monitor Switches & Routers with Nagios XI
 0:04:36
How To Monitor Security Cameras With Nagios XI
 0:05:32
Start reporting in Nagios XI
 0:04:07
Moving Your Nagios XI Installation Made Easy
 0:02:13
Nagios: Upgrading Nagios XI via the Command Line
 0:06:09
How To Monitor Windows Servers With Nagios XI
 0:04:21
WMI Monitoring - Windows Monitoring with Nagios XI
 0:48:54
Troy Lea: Nagios XI Best Practices | Nagios Con 2015
 1:07:14
Nagios XI
Комментарии