filmov
tv
Scatter Plot Matrix and Correlation Matrix in NCSS

Показать описание
The dataset shown has crime statistics and some potentially related demographics for 50 cities. The first two columns give overall and violent crime rates, respectively. The next column contains a police funding rate. The next 3 columns are comprised of education percentage statistics. The final column distinguishes the region.
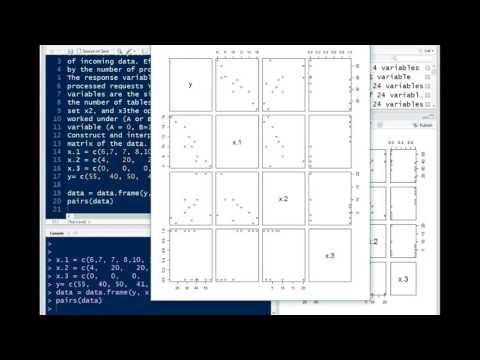
The Scatter Plot Matrix procedure can be used to see the relationship of each of these variables with the other. The points can also be grouped by region. One can double-click on an individual plot to enlarge it for viewing, saving, or printing.
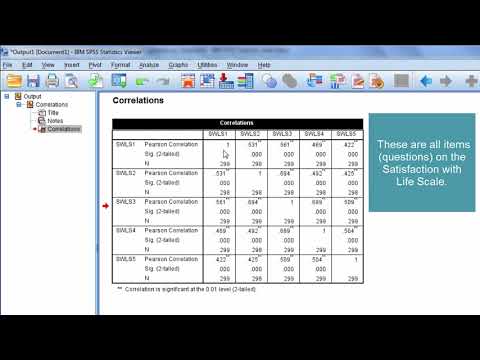
The Correlation Matrix procedure can be used to examine the same relationships numerically. A clustered heat map of the variables, based on correlations, shows natural groupings of the variables. The eigenvector (or principal component) plot also shows the groupings of the variables. As would be expected, the education and crime rate variables form distinct groups.
The Pearson Correlation is shown by default, but other correlation measurements are available.
The Scatter Plot Matrix procedure can be used to see the relationship of each of these variables with the other. The points can also be grouped by region. One can double-click on an individual plot to enlarge it for viewing, saving, or printing.
The Correlation Matrix procedure can be used to examine the same relationships numerically. A clustered heat map of the variables, based on correlations, shows natural groupings of the variables. The eigenvector (or principal component) plot also shows the groupings of the variables. As would be expected, the education and crime rate variables form distinct groups.
The Pearson Correlation is shown by default, but other correlation measurements are available.
 0:02:42
 0:08:34
 0:04:51
 0:04:43
 0:01:02
 0:17:03
 0:12:38
 0:00:28
 0:20:44
 0:03:18
 0:07:11
 0:05:48
 0:09:24
 0:01:12
 0:10:40
 0:04:01
 0:01:24
 0:04:27
 0:02:02
 0:06:43
 0:05:55
 0:04:37
 0:04:44
 0:06:03