filmov
tv
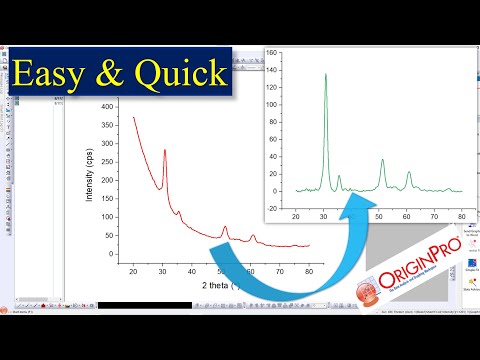
Multiple XRD spectra in a single graph - 30

Показать описание
In this video, I have shown how to plot multiple XRD spectra in a single graph using OriginLab software. If you have any questions, ask them in the comment section below. For more videos, please subscribe to NanoWorld. Thank you.
#NanoWorld
_______________________________________
For more updates follow us on,
_______________________________________
Please check it out, here is a list of my more useful videos.
Interpretation of SAED pattern | estimation of d-spacing & (khl) values
How to put a scale bar on SEM & TEM images (SEM/TEM data analysis)
No valid atomic position available (Rietveld refinement through X’pert Highscore)
Negative intensities in scan data points (Rietveld refinement through X’pert Highscore)
Indexing XRD peaks with Miller indices (hkl) values using X’pert Highscore software
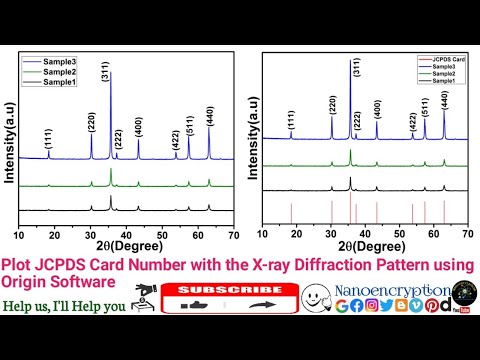
How to plot JCPDS card with the XRD data using OriginLab software
XRD data analysis using X’pert Highscore software
Deconvolution of photoluminescence PL spectra (PL peaks fitting)
How to find peak position and FWHM of XRD data
How to calculate crystallites (grain) size from XRD data?
Estimation of grain size through modifies Scherrer equation
Crystallites size and strain using W-H plot method
Calculation of nanoparticle size through SEM image
How to find Miller indices of XRD peaks?
How to calculate d-spacing from XRD data?
How to calculate lattice constant (a, b, c) values from the XRD data?
How to calculate microstrain and dislocation density from XRD data?
How to calculate crystallinity from XRD data?
How to smooth XRD data?
Baseline correction for XRD data
Cyclic Voltammetry Data Analysis
How to find bandgap energy using the Tauc plot method?
How to calculate bandgap energy using the Kubelka Munk function?
Understanding Tauc plot, 1240 (constant) and 2.303 constant
How to know a material either have direct or indirect bandgap energy?
DSC Data Analysis
TGA Data Analysis
How to plot the double Y-axis in a single graph?
Electron paramagnetic resonance (EPR) data analysis (calculation of g-factor)
#NanoWorld
_______________________________________
For more updates follow us on,
_______________________________________
Please check it out, here is a list of my more useful videos.
Interpretation of SAED pattern | estimation of d-spacing & (khl) values
How to put a scale bar on SEM & TEM images (SEM/TEM data analysis)
No valid atomic position available (Rietveld refinement through X’pert Highscore)
Negative intensities in scan data points (Rietveld refinement through X’pert Highscore)
Indexing XRD peaks with Miller indices (hkl) values using X’pert Highscore software
How to plot JCPDS card with the XRD data using OriginLab software
XRD data analysis using X’pert Highscore software
Deconvolution of photoluminescence PL spectra (PL peaks fitting)
How to find peak position and FWHM of XRD data
How to calculate crystallites (grain) size from XRD data?
Estimation of grain size through modifies Scherrer equation
Crystallites size and strain using W-H plot method
Calculation of nanoparticle size through SEM image
How to find Miller indices of XRD peaks?
How to calculate d-spacing from XRD data?
How to calculate lattice constant (a, b, c) values from the XRD data?
How to calculate microstrain and dislocation density from XRD data?
How to calculate crystallinity from XRD data?
How to smooth XRD data?
Baseline correction for XRD data
Cyclic Voltammetry Data Analysis
How to find bandgap energy using the Tauc plot method?
How to calculate bandgap energy using the Kubelka Munk function?
Understanding Tauc plot, 1240 (constant) and 2.303 constant
How to know a material either have direct or indirect bandgap energy?
DSC Data Analysis
TGA Data Analysis
How to plot the double Y-axis in a single graph?
Electron paramagnetic resonance (EPR) data analysis (calculation of g-factor)
 0:13:09
Multiple XRD spectra in a single graph - 30
 0:08:32
How to stack XRD data in origin - Step-by-Step Tutorial
 0:09:16
| How to Merge XRD spectra | How to Plot Multiple XRD files| Plot Different XRD in One Graph|
 0:05:29
HOW TO PLOT MULTIPLE XRD SPECTRA IN ONE GRAPH|HINDI/URDU
 0:11:33
How to plot data (XRD) data in Origin - Complete guide!
 0:10:10
How to plot XRD | Professionally & Scientifically | Origin
 0:00:52
How Can I Display Multiple XRD Spectra in a Single Graph Efficiently?
 0:05:34
How to plot JCPDS card with the XRD data using Origin
 0:10:25
Plotting multiple Spectra on a single figure using excel
 0:16:15
Graphing XRD Data in Excel - Adding an XRD Reference Spectrum to Graph
 0:08:36
How To Analyse XRD Data / Plot / Graph in Research Paper? Experimental Paper Skills
 0:14:48
How to combined and perform indexing of XRD Pattern using Origin Software
 0:10:00
How to plot JCPDS card data with the XRD data using origin.
 0:12:46
Draw a set of folders or multiple graphs in one image using Origin | VKMeV
 0:18:08
Plot JCPDS Card No. with the X-ray Diffraction Pattern using Origin Software.
 0:09:16
How to Normalize Data using Origin Software
 0:00:49
Find peaks, Label peaks, and Remove Unwanted Labels in Origin
 0:05:18
How to draw stack plot using Origin Software
 0:01:07
Graphing: Origin 9.1: Dragging to Change Spectrum Offsets on a Graph
 0:16:08
How to deconvolute a peak / multiple peaks fitting in origin
 0:08:55
How to normalize and stack XRD plots using Origin Software
 0:04:41
Baseline correction in origin for XRD| FTIR| UV-visible| XPS |Raman| data Smoothing
 0:01:00
How to find peaks with one click in origin
 0:03:41
How to correct baseline | remove Background | Origin | Easy
Комментарии