filmov
tv
Graph from database table example - SQLite3 with Python 3 part 4

Показать описание
In this tutorial, we're going to show how you can use a select query, and iterate through it, to get data that you can make use of. In this example, we're going to generate a Matplotlib graph
 0:06:26
Graph from database table example - SQLite3 with Python 3 part 4
 0:01:05
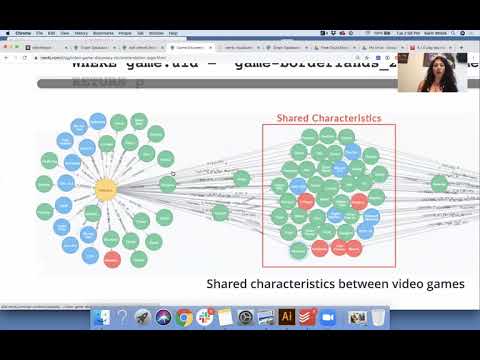
Graph Databases in 60 seconds
 0:19:46
SQL Server Graph Table schema design, migration and performance
 0:31:09
Graph Databases Will Change Your Freakin' Life (Best Intro Into Graph Databases)
 0:10:58
What is a graph database? (in 10 minutes)
 0:18:23
Types of Databases: Relational vs. Columnar vs. Document vs. Graph vs. Vector vs. Key-value & mo...
 0:46:56
SQL Server 2017 Graph Database
 0:17:06
Intro to Graph Databases Episode #4 - (RDBMS+SQL) to (Graphs+Cypher)
 0:57:15
Live Interactive Session 3 : Learning Analytics Tools
 0:08:58
How to Create Graph Tables in SQL Server
 0:49:32
Dungeons, Dragons, and Graph Databases by Guy Royse
 0:02:20
D3.js in 100 Seconds
 0:06:42
Knowledge Graph Construction Demo from raw text using an LLM
 0:54:11
FileMaker and Graph Databases [INT19]
 0:20:58
Amazon Neptune Database | AWS Graph Database | Visual Explanation
 0:09:51
SQL Server Tutorial - One-to-many and many-to-many table relationships
 0:03:11
PHP & MySQL Tutorial: Displaying Database Data in HTML Tables
 0:00:30
Graph databases in action. #aerospike #graph #data
 0:14:26
What is a Graph Database? | Getting Started with Neo4j AuraDB: A Step-by-Step Tutorial 🔥
 1:07:41
'What do Graph Tables bring to the table' By Hasan Savran
 0:08:04
How To Create Chart Or Graph On HTML CSS Website | Google Charts Tutorial
 0:05:46
How to draw a network diagram/graph given an activity table (Example 4)
 0:19:00
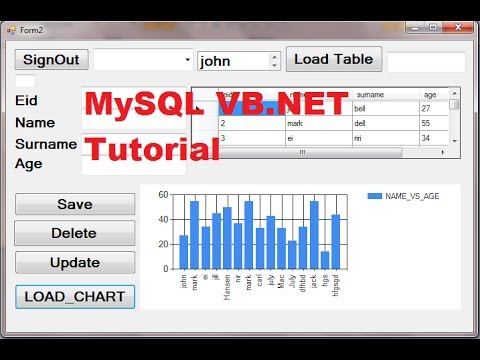
MySQL VB.NET Tutorial 16 : How to Link Chart /Graph with Database
 0:09:22
What is Graph Database? (Its Use Cases, Examples & Properties)
Комментарии