filmov
tv
How to use Microsoft Excel to create graphs (Column graph, Histogram, Time Series)

Показать описание
Mathematics aimed at high school students. If you have any questions, please post them in the comments below.
0:00 - Intro
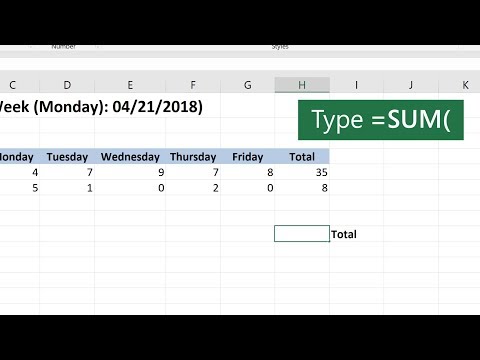
1:04 - Column Graph
4:38 - Histogram
9:39 - Time Series
12:55 - Outro
0:00 - Intro
1:04 - Column Graph
4:38 - Histogram
9:39 - Time Series
12:55 - Outro
 0:16:17
 0:54:55
 0:07:08
 0:20:28
 0:32:49
 0:11:54
 0:00:38
 2:26:10
 0:00:17
 0:00:16
 0:09:56
 0:02:38
 0:00:10
 0:21:47
 0:00:37
 0:00:42
 0:15:24
 0:00:26
 0:00:29
 0:00:30
 0:27:49
 0:00:54
 0:12:29
 0:00:21