filmov
tv
SAP HANA database performance issue | Generic Symptoms

Показать описание
Please visit our blog to get more knowledge.
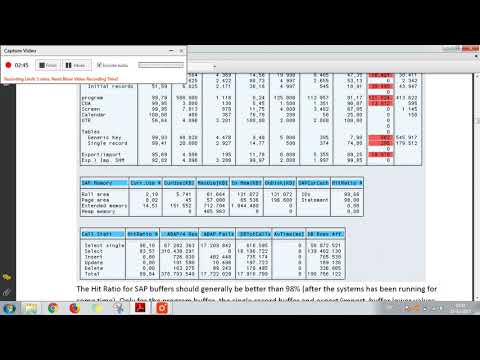
The purpose of this video is to help you to find the probable root cause of some generic problems.
*** Component memory allocation *****
SELECT host, component, sum(used_memory_size) used_mem_size FROM PUBLIC.M_SERVICE_COMPONENT_MEMORY
group by host,component ORDER BY sum(used_memory_size) desc;
*** Active statements ***
Select "LAST_EXECUTED_TIME","APPLICATION_SOURCE", "CONNECTION_ID","STATEMENT_ID","STATEMENT_STATUS","STATEMENT_STRING", "USED_MEMORY_SIZE", "LAST_ACTION_TIME" from "SYS"."M_ACTIVE_STATEMENTS"
Troubleshooting High Memory consumption in SAP HANA
SAP HANA database performance issue | Generic Symptoms
Fix High CPU utilization issue of the HANA System #hana #performance
SAP Hana Performance issue : Generate Full system info dump
Troubleshooting High CPU in SAP HANA
SAP System Performance issues identification Part_1
Performance tuning techniques in SAP HANA - Part 1
SAP HANA 2.0 - SYSTEM DOWN ISSUES FIXING (PERSISTENCE LAYER CORRUPTED)
SAP HANA Basics For Developers: Part 7.11 SQLScript Performance Analysis
SAP Hana Performance Techniques Week3 Unit5 Optimize join - SAP Learning
Hands-On: Simple Query Performance Analysis - W3U5 - SAP HANA Query Optimization
SAP HANA IMPORTANT INTERVIEW QUESTIONS-2023
SAP Hana Performance Deep Dive and Migration Week4 Unit 4 Troubleshooting – Tips and tricks
How to Analyze CDS Performance| Plan Visualizer Tool | Dependency Analyzer
SAP BW4HANA Performance Optimization
Solving performance problems in Oracle / MS SQL SAP HANA, PostgreSQL databases (english subtitles)
SAP BASIS INTERVIEW QUESTIONS TROUBLE SHOOTING
Case 1 – Issue Conclusion - W4U3 - A First Step Towards SAP HANA Query Optimization
Troubleshooting Log Volume full in Hana Database #hana #sap #odiaengineer #saptraining
Visualized Plan - W2U4 - A First Step Towards SAP HANA Query Optimization
Column Searches in the Traces - W2U6 - A First Step Towards SAP HANA Query Optimization
Troubleshooting: Common Issues
SAP Hana Performance Techniques Week3 Unit2 Static cache - SAP Learning
Case 2 – Applying the Solution - W4U7 - A First Step Towards SAP HANA Query Optimization
Комментарии
 0:04:24
 0:20:13
 0:15:15
 0:06:46
 0:04:12
 0:05:00
 0:07:51
 0:48:16
 0:15:23
 0:05:50
 0:04:26
 0:46:50
 0:16:40
 0:20:04
 0:07:19
 0:46:20
 0:19:23
 0:09:11
 0:01:36
 0:12:42
 0:05:14
 0:16:25
 0:08:05
 0:04:46