filmov
tv
Mean smoothing time series plots using Excel and Trendline forecasting

Показать описание
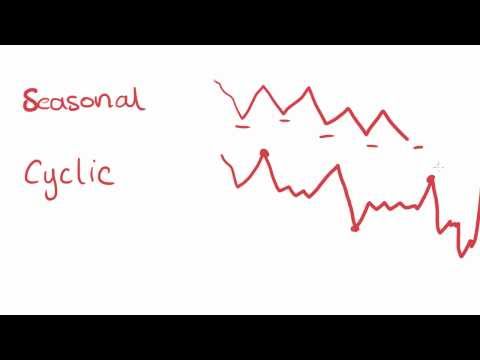
Looks at how to smooth out the natural irregular fluctuations we see in real life data to clarify trends using mean-smoothing on Excel. Also delves into trend line forecasting to use the model developed to predict future values. Unit 3 QLD 12 General Maths. Includes practice SF and CF questions with worked solutions.
Copy of Excel spreadsheets to open, save and use yourself:
Lesson objectives:
• Smoothing time series data using moving averages using Excel
• Techniques of odd and even mean-smoothing
• Plotting raw and smoothed time series data onto Excel graphs
• Fitting least squares regression lines to smoothed time series data to use in trend line forecasting using Excel
 0:30:14
 0:22:34
 0:06:00
 0:20:09
 0:10:25
 0:08:08
 0:21:12
 0:29:30
 0:20:01
 0:08:48
 0:07:29
 0:10:41
 0:06:22
 0:05:01
 0:08:59
 0:13:43
 0:11:48
 0:05:44
 0:07:10
 0:08:48
 0:08:14
 0:13:33
 0:04:59
 0:14:05