filmov
tv
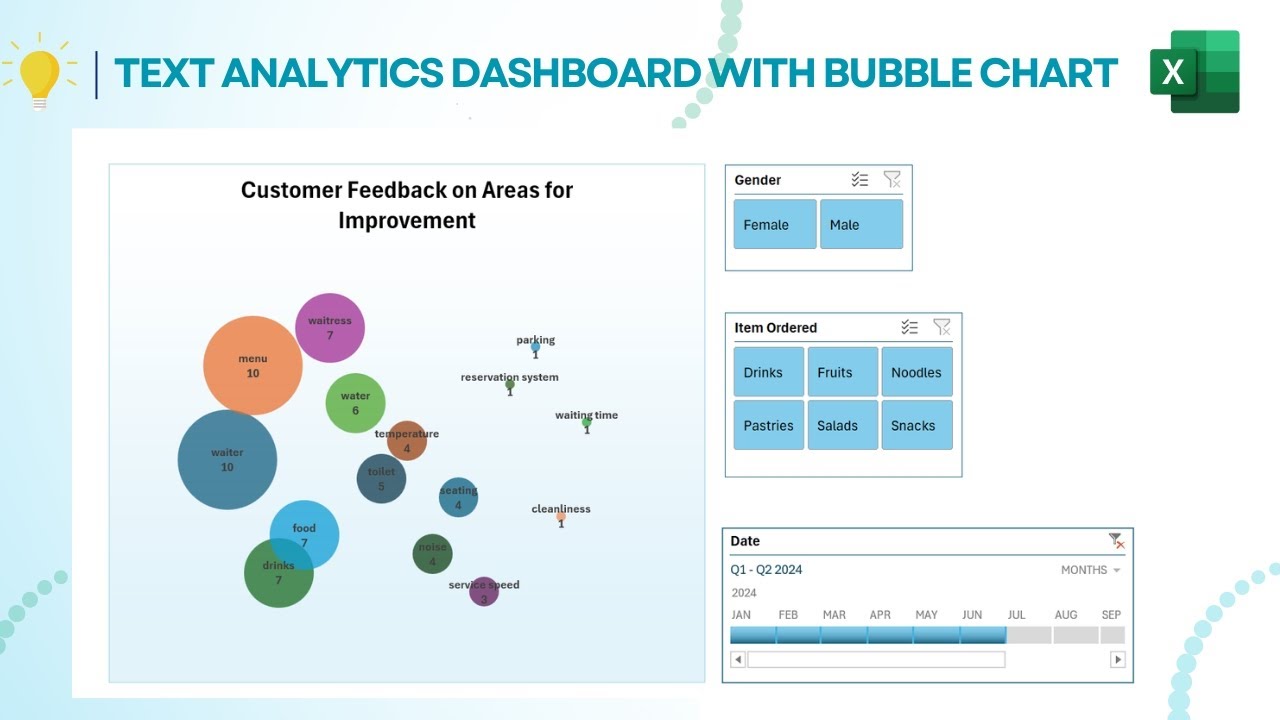
Create a Text Analytics Dashboard in Excel using Cartesian Join and Bubble Charts
Показать описание
ow to Use Excel's Power Query for Text Analytics with Bubble Charts
Learn how to master text analytics in Excel using Power Query! In this tutorial, we'll guide you through the process of comparing feedback responses against a list of keywords using a Cartesian Product or Join. We'll extract key phrases, analyze data with Power Pivot, and visualize insights using PivotTables, dynamic array functions, and XY bubble charts. Perfect for beginners and advanced users, this video covers everything you need to create powerful, interactive dashboards in Excel. Whether you're analyzing customer feedback or any text data, this tutorial is a must-watch!
Chapters:
0:00 Introduction
2:32 Setting Up for Power Query
3:04 Getting Data from Google Forms
5:35 Extract other Queries
8:40 Creating Cartesian Product
13:06 Using Power Pivot for Data Analysis
15:40 Staging Calculations for XY Bubble Chart
18:20 Dynamic Array Functions in Action
22:15 Visualizing with PivotTables and Bubble Charts
29:31 Conclusion
Resources:
Start file:
🔔 Don't forget to subscribe for more Excel tutorials and tips! 🔔
Tags: #Excel #PowerQuery #TextAnalytics #BubbleChart #DataVisualization #ExcelTutorial #PowerPivot #PivotTables #DynamicArrays #CustomerFeedback
 0:30:28
 0:06:02
 0:15:05
 0:06:25
 0:12:40
 0:36:44
 0:30:27
 0:05:06
 1:05:31
 0:06:49
 0:52:25
 0:07:02
 0:05:24
 0:23:15
 0:00:30
 0:10:52
 0:50:52
 0:12:28
 0:21:14
 0:32:54
 0:03:54
 0:26:43
 0:10:16
 0:29:58