filmov
tv
Visualising Wind from a GRIB Mesh Layer in QGIS and Create an Animated GIF

Показать описание
Today we're going to visualise storm Eunice. We'll use a GRIB mesh file with wind predictions from the HARMONIE-AROME Cy40-model. Then we style it with arrows and traces in QGIS, set up the Temporal Controller and a counter. Finally, we'll export the frames to create animations with GIMP.
Country boundary from PDOK.
0:00 Introduction
1:15 Adding the data
1:55 Styling GRIB mesh with arrows
3:24 Adding a counter
6:17 Adding scale bar and legend
8:40 Exporting the frames
9:08 Create animated GIF in GIMP
10:18 Style GRIB mesh with traces
#QGIS
Country boundary from PDOK.
0:00 Introduction
1:15 Adding the data
1:55 Styling GRIB mesh with arrows
3:24 Adding a counter
6:17 Adding scale bar and legend
8:40 Exporting the frames
9:08 Create animated GIF in GIMP
10:18 Style GRIB mesh with traces
#QGIS
 0:12:13
Visualising Wind from a GRIB Mesh Layer in QGIS and Create an Animated GIF
 0:00:05
Steaming Data Visualization- Global Wind Direction Simulation (3D)
 0:00:49
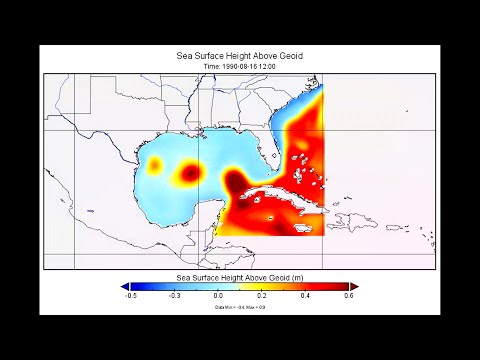
visualize precipitation data stored in grib file
 0:09:07
Visualise Precipitation Data from Mesh in Animations and Graphs
 0:00:31
Wind Visualisation
 0:00:22
Confetti in the Wind (Data Visualisation with Java)
 0:00:05
Steaming Data Visualization- WindField Simulation (3D Particle)
 0:02:14
Maximizing Wind Energy Production Using Wake Optimization
 0:05:52
Visualize precipitation data stored in grib file
 0:26:35
ECMWF Webinar: Data manipulation and visualisation - Processing and visualising ECMWF ensemble data
 0:12:28
2D and 3D stress transformation visualization in MATLAB.
 0:03:37
Tuft Flow Visualization in Wind Tunnel | Fluid Dynamics Magic | Turbulence | Active Grid
 0:00:02
Streaming Data Visualization- Real-time Simulation of Wind Power
 0:00:48
WIND-OW (typhoon data visualization)
 0:10:46
Flow Visualization overview
 0:05:38
How to fix clean energy’s storage problem
 0:01:51
Meet ChatGrid™: a new AI-powered grid visualization tool
 0:55:33
ECMWF Webinar: Visualisation of ECMWF data
 0:00:39
This Optical Illusion Will Trick Your Mind
 0:09:20
Part 7: Layout and Visualisation of Wind Farms Using OpenFAST | Running FAST-Farm | Wind Turbine
 0:09:15
Real vs Reactive Power
 0:15:25
Simulating and visualizing the most devastating thunderstorms [SC14]
 0:17:03
ESM.2.6 Panoply for qucik netCDF data access and visualization
 0:01:40
Recursion in 100 Seconds
Комментарии