filmov
tv
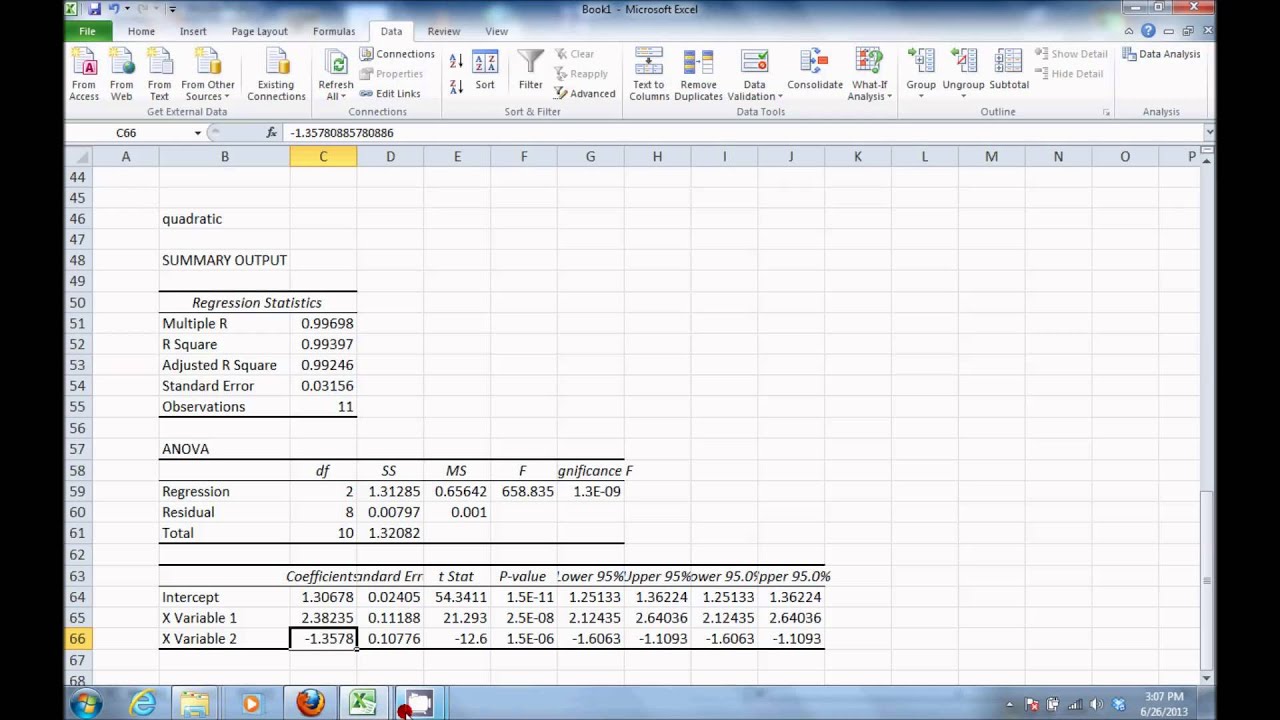
Quadratic Regression Analysis in Excel
Показать описание
This video providses step-by-step instructions on how to do a quadratic (2nd-order) regression analysis (least-squares curve fit) using Microsoft Excel, and then how to plot the results.
You can also watch all related short videos with one click by going to one of Dr. Cimbala's playlists:
You can also watch all related short videos with one click by going to one of Dr. Cimbala's playlists:
 0:04:51
Quadratic Regression Analysis in Excel
 0:03:43
Quadratic Regression in Microsoft Excel
 0:10:31
Quadratic regression in Excel
 0:07:15
Excel - Polynomial Quadratic Regression
 0:29:30
Comparing Linear, Quadratic and Cubic Regression in Excel Simplified 2
 0:09:38
How to Run a Quadratic Regression in MS Excel 2007
 0:10:58
Estimating a Quadratic Regression Model using the Data Analysis ToolPak in Excel
 0:21:55
Regression: Polynomial Regression in Excel
 1:05:35
A Perfect Fit: Finding Exact Versus Approximate Models
 0:12:39
Quick Tutorial - Running Linear, Quadratic and Cubic Regression in Excel
 0:04:49
Quadratic Regression Model
 0:03:06
Get quadratic equation using a formula in excel
 0:04:31
Quadratic Regression
 0:03:07
Linear and Quadratic Regression using Excel
 0:13:00
4.4.6 - Quadratic Regression (using Excel)
 0:04:03
Polynomial Regressions
 0:29:36
Excel Tutorial: Creating a mathematical model; Simulating data; Fitting a Polynomial Regression
 0:08:10
Quadratic and Exponential Regression in Excel 2016
 0:12:31
INH: Polynomial Regression with Excel
 0:04:04
Quadratic Regression
 0:16:29
6.2b Regression Model with Quadratic terms
 0:09:30
Polynomial Regression in Excel 2010
 0:04:17
Using the EXCEL LINEST function to calculate flux using Quadratic Regression
 0:06:31
Linear and Polynomial Regression in Microsoft Excel
Комментарии