filmov
tv
Relationships between categorical variables

Показать описание
In this video you’ll learn how to plot data on two categorical variables so that you can look for relationships between them.
After you’ve watched this video, you should be able to answer these questions
•We distinguished between an outcome variable and predictor variables. What is an outcome variable and what are predictor variables?
•What are the strengths and weaknesses of using separate bar graphs of a response variable for each predictor group?
•What are the strengths and weaknesses of using side-by-side bar graphs to show the relationship between a response variable and a predictor variable?
•Which type of graph should you look at?
•In terms of separate bar graphs for each predictor group, what would you expect to see if there was no relationship between the outcome variable and the predictor variable?
•What are you looking for when you use side by side bar charts?
 0:06:28
Relationships between categorical variables
 0:06:56
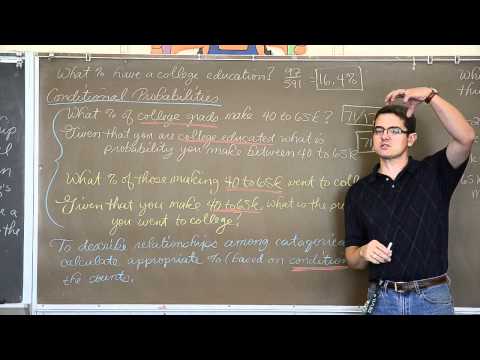
Stats Honors: 3.1 Relationships Between Two Categorical Variables
 0:04:40
Calculate Correlation Among Categorical Variables in Python
 0:12:42
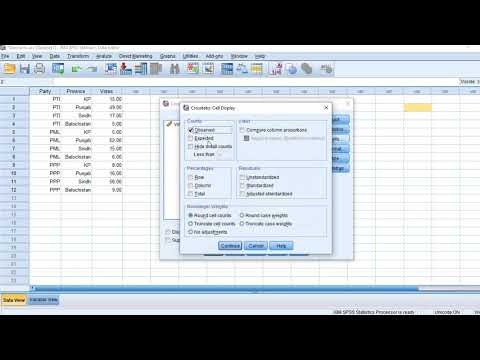
Exploring relationships between variables in SPSS
 0:07:17
SPSS Vid18 Categorical Variable Relationships
 0:04:24
Association between categorical variables
 0:07:52
3.1 Relationship Between Two Categorical Variables
 0:12:41
Relationship between categorical variables in a 2 way table
 0:01:03
sciencefather | Mastering Categorical Data Analysis in 60 Seconds#sciencefather #DataAnalysis
 0:17:40
Applied Stats 2.3 Exploring the Relationship Between Two Categorical Variables - Contingency Tables
 0:16:23
Chi-squared test - testing for relationships between categorical variables (Excel)
 0:08:33
Section 1.1B Relationships Between Categorical Variables
 0:02:09
Showing relationships between two categorical variables using SPSS
 0:04:24
Correlation between Categorical Features
 0:03:22
How to explore the relationship between two categorical variables using clustered SPSS
 0:03:00
How to explore the relationship between two categorical variables using Stack bar on SPSS
 0:06:10
Summarizing a categorical Variable and the Relationship Between Two Categorical Variables Using R
 0:15:17
Relationships Between TWO Categorical Variables - AP Statistics Unit 2 Summary Topics 2.2 & 2.3
 0:12:57
2.1 Relationships between two Categorical Variables
 0:05:47
Association of Categorical Variables | Cramer's V
 0:23:02
Lecture 4.9 - Association between categorical and numerical variables
 0:04:47
Methods to Visualize the Relationship between Two Categorical Variables Excel
 0:04:37
Exploring relationships between categorical variables
 0:27:37
Probability & Statistics Lesson 2-1: Relationship between Categorical Variables
Комментарии