filmov
tv
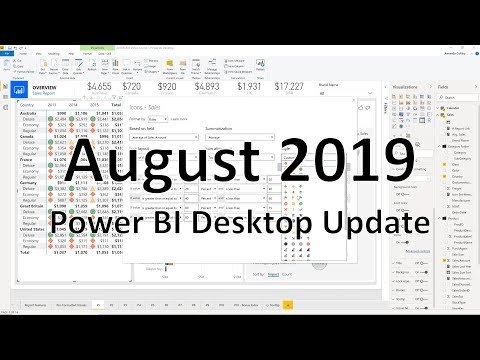
Power BI Desktop Update - August 2019
Показать описание
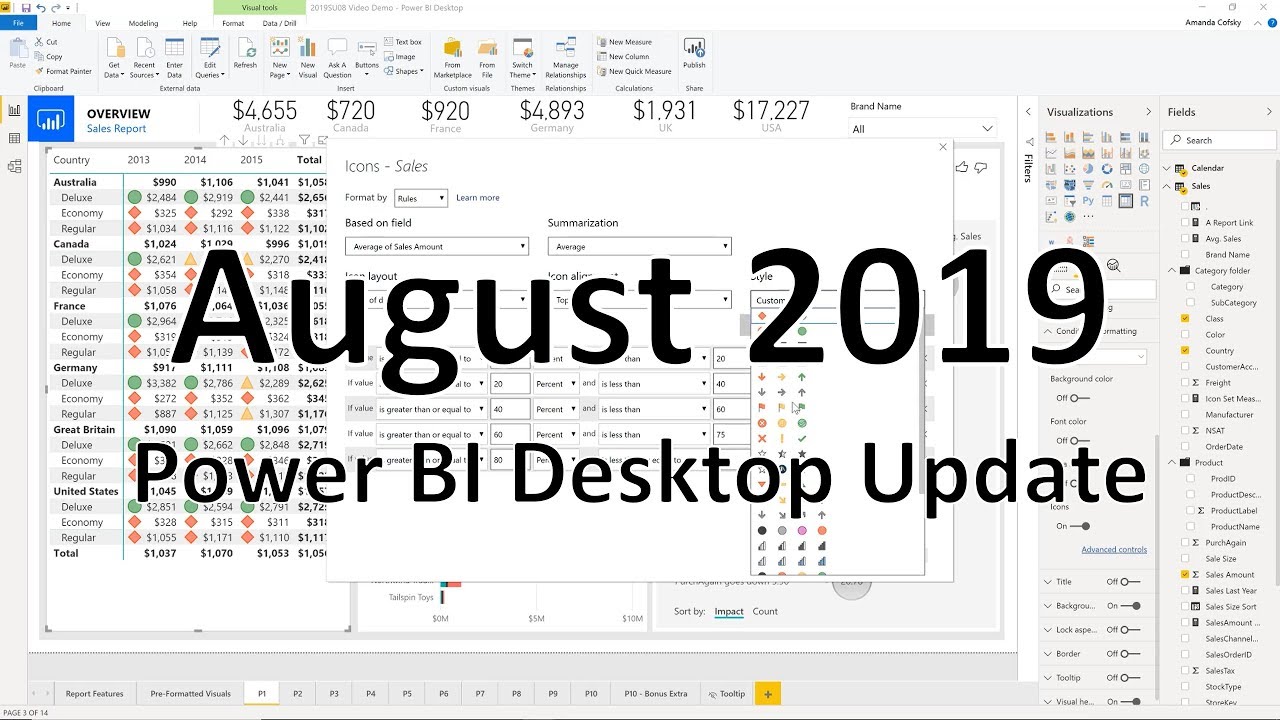
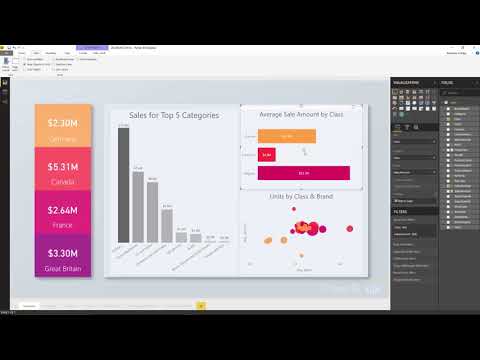
Our August release has another hotly anticipated feature from the Microsoft Business Application Summit, grouping. Grouping in reports, similar to PowerPoint's grouping, lets you easily organize groups of visuals to move and resize them as a set. This month's release also has some updates to our newest features, such as a icon set picker for our newly added icons conditional formatting and measure support for key influencers.
Grouping visuals - 0:10
Filter pane auto-update dialog - 6:00
Icon styles for Icon sets - 8:30
Conditional formatting warnings - 10:21
Key influencers improvements - 13:21
Multiple axis chart - 15:56
Marimekko chart - 20:06
Variance chart - 22:47
Horizon chart - 24:15
SAP HANA HDI containers - 25:05
SAP variables - 25:20
PostgreSQL DirectQuery - 27:43
MarkLogic - 27:58
Power Platform Category - 28:08
 0:06:04
 0:02:39
 0:04:03
 0:33:21
 0:04:11
 0:04:18
 0:04:40
 0:26:29
 1:25:40
 0:02:09
 0:06:04
 0:21:16
 0:14:49
 0:28:34
 0:30:11
 0:49:17
 0:45:40
 0:12:16
 0:31:29
 0:39:55
 0:37:47
 0:20:42
 0:34:12
 0:08:46