filmov
tv
Scatterplots in R with geom_point() and geom_text/label()

Показать описание
In this tutorial I show you how to create and label scatterplots in R with geom_point(), geom_text/label() and ggplot().
I will explain the different function arguments, how you can map the color or shape to certain variables of your data frame and how to configure text you might want to add to the points.
In the end I show you how you can quickly turn a scatterplot interactive with hover-over functionality.
⏱ Time Stamps ⌚
0:00 - Intro
0:26 - geom_point with iris
1:50 - alpha and shapes
5:25 - coloring
9:02 - size and stroke
10:36 - marginal distribution
12:51 - geom_text/label
13:36 - text alignment
15:27 - font and color options
17:50 - ggrepel
18:45 - plotly interactive
External Links:
Background Music:
Outro Animation:
AA-VFX Motion Backgrounds
 0:20:23
Scatterplots in R with geom_point() and geom_text/label()
 0:03:48
GGPlot - Scatter plot and GEOM POINT
 0:02:43
Draw ggplot2 Plot with Lines & Points in R (Example) | Add Scatterplot Line | geom_line & ge...
 0:25:01
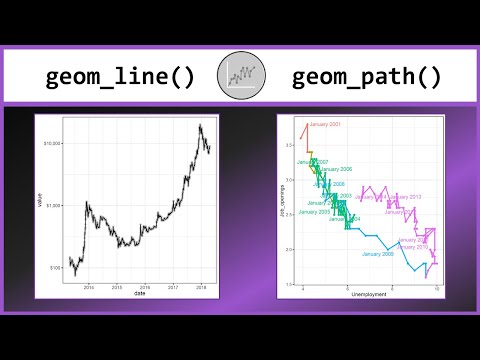
Line charts and Connected Scatterplots in R with geom_line() and geom_path()
 0:08:38
ggplot Scatter Plot, geom_point (first plot) - R Lesson 11 CradleToGraveR
 0:09:31
Geom Point, Line, and Errorbar Publication Quality Plotting using R and ggplot for Biologist
 0:02:56
ggplot2 package in r | create a smooth line and add points using geom argument
 0:10:14
ggplot scatterplots in R
 0:03:32
Specify Different Colors for Points that are Connected by Lines in a ggplot2 Plot in R (Example)
 0:04:19
Plot Only One Variable in ggplot2 Plot in R (2 Examples) | Draw Scatterplot | qplot() & seq_alon...
 0:08:22
How to Make a Scatter Plot in R
 0:03:22
Shape, color, and size of points with ggplot2 in R (3 minutes)
 0:07:45
Enhanced scatterplot : Side plots in ggplot2 using geom_*side^() of ggside package
 0:11:48
GGPlot - GEOM SEGMENT
 0:05:44
R programming - Start building graphs with ggplot2 in R. #rprogramming
 0:00:21
R ggplot2 geom_point + geom_smooth
 0:01:40
GGPlot - GEOM JITTER
 0:03:56
GGPlot - GEOM HLINE, GEOM VLINE, GEOM ABLINE
 0:22:54
PMAP 8921 • (9) Annotations: (2) Text in plots
 0:08:03
R// nuage de points avec ggplot2 (scatter plot)
 0:08:44
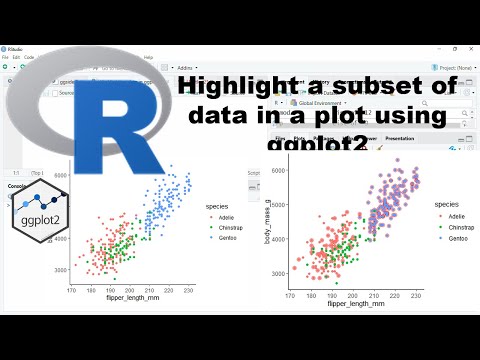
Highlight subset of data in a plot using ggplot2
 0:06:48
ggplot2 package in r | ggplot scatter plot with geom_point
 0:21:31
R - Graphs - Scatter Plots in Ggplot2
 0:08:16
GGPlot - GEOM AREA
Комментарии