filmov
tv
Kibana Lens: intuitive and easy

Показать описание
Kibana Lens is an easy-to-use, intuitive user interface that simplifies the process of data visualization through a drag-and-drop experience. Whether you're exploring billions of logs or spotting trends from your website traffic, Lens gets you from data to insights in just a few clicks. Join us for an overview of Kibana and an introduction to Lens with a live demo. Thank you so speaker, Rashmi Kulkarni.
 0:48:05
Kibana Lens: intuitive and easy
 0:04:15
Kibana Lens Overview (Beta): An easy, intuitive way to visualize Elasticsearch data
 0:03:06
Creating your first visualization with Kibana Lens
 0:07:51
Kibana Lens in 5 minutes
 0:29:35
Kibana Visualization Deep Dive:Unleashing Kibana's Potential with Aggregations, Lens, TSVB,
 0:08:00
Elastic 7.10 - Kibana Lens
 0:14:52
Kibana Lens Tutorial
 0:07:22
Kibana Lens - Daily Elastic Byte S02E06
 0:11:54
Lesson 2 - Kibana 8 Training - Simple Visualizations
 0:25:22
Kibana Canvas Tutorial
 0:01:52
Elastic Kibana - How to color pings-over-time chart
 0:00:15
video kibana lens bar tree 710
 0:08:21
How to Create Visualizations and Dashboards in Kibana | Kibana Tutorial
 0:16:47
S2E10:Mini Beginner's Crash Course on Building a Full Stack JavaScript App with Elasticsearch P...
 0:01:19
Kibana Visualization How To's - Pie Charts
 0:05:01
Video 18 - How to create a Kibana Dashboard easily | Centralized Logging | ELK
 0:06:23
Kibana Lesson 1: Introduction to Kibana Visualizations in PeopleSoft 9.2
 0:00:33
Getting Started with Kibana Dashboard (Part 9)-Create Fourth Visualization-Markdown
 0:27:40
Create Kibana Visualisations Using Drag and Drop
 0:02:28
How To Filter Visualizations In Kibana 8?
 0:04:26
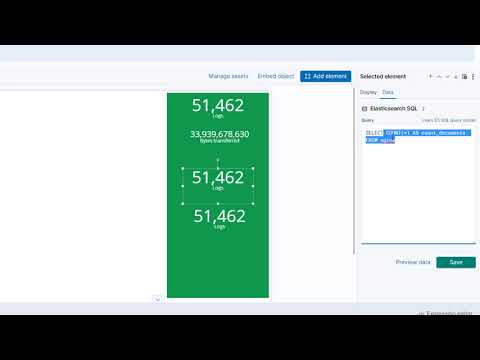
Kibana Canvas in 5 minutes
 0:01:22
Kibana Spaces Overview
 0:02:20
pie chart advanced usage
 0:15:09
Lesson 4 - Kibana 8 Training - Simple Dashboards
Комментарии