filmov
tv
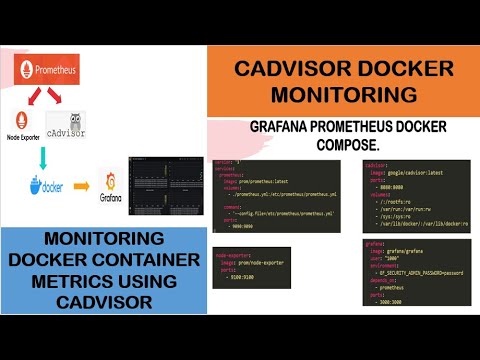
Monitor Docker Containers With cAdvisor, Prometheus And Grafana

Показать описание
Docker is a very popular container platform and like many IT deployments it's a good idea to monitor what's going on
Now while you can monitor the host and have alerts sent before resources run out, at some point you'll want to know more details about resources being used by the individual containers
And one way to monitor containers in Docker is to use cAdvisor as the exporter which will present metrics in a format that Prometheus and Grafana can take advantage of
In this video we go over how to install cAdvisor as a container and configure Prometheus and Grafana to monitor your Docker containers
=============================
SUPPORT THE CHANNEL
Donate through Paypal:
Donate through Buy Me A Coffee:
Become a monthly contributor on Patreon:
Become a monthly contributor on YouTube:
==============================
=============================
MY RECORDING HARDWARE:
Blue Yeti USB Microphone
Blue Radius III Custom Shockmount for Yeti and Yeti Pro USB Microphones
RØDE PSA1 Professional Studio Arm
Aokeo Professional Microphone Pop Filter
Sony Alpha ZV-E10L Mirrorless Camera
Elgato Cam Link 4K Capture Card
Neewer NP-FW50 Dummy Battery Charger Kit
Elgato Key Light Air - Professional 1400 lumens Desk Light
Neewer 2 Packs Tabletop LED Video Light Kit
Elgato Green Screen
=============================
==============================
MEDIA LINKS:
==============================
For more technical information, including commands used, check out our blog post
Useful links:
Chapters
00:00 Intro
00:47 Assumptions
01:01 Create cAdvisor Container
04:50 Initial Testing
11:43 Configure Prometheus
15:41 Install Grafana Dashboard
cadvisor docker monitoring,cadvisor prometheus grafana,cadvisor docker,cadvisor prometheus,cadvisor grafana,install cadvisor,monitor docker containers,monitor docker containers with grafana,monitor docker with prometheus,monitor docker with grafana,monitor docker with prometheus and grafana
 0:20:12
 0:01:35
 0:25:05
 0:13:39
 0:25:21
 0:09:53
 0:06:32
 0:11:35
 0:17:45
 0:23:57
 0:05:20
![[Lab 55] Monitoring](https://i.ytimg.com/vi/nzf2pSnsuZs/hqdefault.jpg) 0:07:58
0:07:58
 0:06:59
 0:09:41
 0:14:11
 0:08:37
 0:05:37
 0:03:07
 0:25:57
 0:05:19
 0:18:08
 0:02:09
 0:01:06
 0:09:21