filmov
tv
SSRS Tutorial 66 - How to Display Total on top of Stacked Chart in SSRS Report

Показать описание
In this video series of SSRS Tutorial, we are going to learn "How to Display Total on top of Stacked Chart in SSRS Report"
We will learn following items in video while creating Stacked Chart Report with Total
Definition :
A stacked bar chart displays all series stacked in a single bar for each category
How to prepare SQL Server for Stacked Chart Report with Totals
How to use Chart Item in SSRS to create Stacked Chart
How to use Show Data Labels to display data for Series
How to Display Total on Top in Column for Stacked Chart
Check out our Step by Step SSRS Tutorial
 0:09:38
SSRS Tutorial 66 - How to Display Total on top of Stacked Chart in SSRS Report
 0:06:17
SSRS Tutorial 76 - How to Create Bar Stacked Chart in SSRS Report
 0:09:07
SSRS Tutorial 20 - Create Report with Group on Page without Wizard in SSRS
 0:07:40
MS SSRS tutorial on adding data bars and indicators (cell graphics)
 0:05:25
SSRS Tutorial - Calculate Running Total
 0:13:04
MS SSRS tutorial on using expressions to format cells
 0:11:02
SSRS Tutorial 79 - How to Create Line Chart in SSRS Report
 0:12:53
SSRS Tutorial 60 - How to Create Column Chart in SSRS
 0:07:00
SSRS Tutorial - Stacked Bar Chart
 0:05:03
SSRS Reports Training - Indicators
 0:27:49
SSRS 11 Report Properties By Bhaskar Reddy Baddam
 0:11:18
SSRS Tutorial 65 - How to Create Stacked Column Chart Report in SSRS
 0:01:29
Reporting Service(SSRS) Insert Rownumber()
 0:07:19
SSRS Tutorial 24 - How to Add Running Total To Tabular Report in SSRS
 0:07:54
SSRS Tutorial 69 - How to Custom Color Columns in Column Chart in SSRS Report
 0:10:17
SSRS Tutorial 64 - How to Rotate Text in SSRS Report
 0:07:56
SSRS Tutorial 71 - How to Display Percentage in Pie Chart in SSRS Report
![[Not Recommended anymore]](https://i.ytimg.com/vi/g0YIc-uJW9M/hqdefault.jpg) 0:01:54
0:01:54
[Not Recommended anymore] SQL Report Chart - How to work with Top N and sorting
 0:21:44
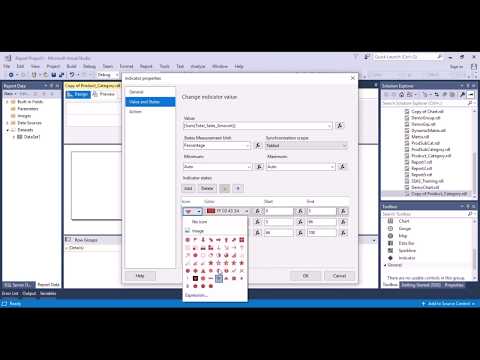
SSRS Tutorial Part 85 - How to use Indicator in SSRS Report
 0:00:19
SSRS chart report y axis data range selection
 0:41:45
SSRS Video2-insertindetail
 0:15:00
SSRS Tutorial 84 - Implement Interactive Sorting on Matrix in SSRS Report
 0:08:59
SSRS Tutorials - 7.Your first chart - Build / Sort / Filter / Color / Data Label
 0:10:49
SSRS Tutorial 80 - How to Create 100% Stacked Column/Bar Chart in SSRS Report
Комментарии