filmov
tv
Data and Information Flow Diagrams

Показать описание
Explaining with examples what Data Flow Diagrams (DFDs) are, with the different between Level 0 and Level 1 DFDs. The difference between these and Information Flow Diagrams (IFDs) is also explained.
This video is primarily designed for the written exam (Component 3: Effective Digital Working Practices) for the Pearson Edexcel BTEC Level 1/2 Tech Award in Digital Information Technology. Video #3 of D1.
For the ordered playlist of videos for the Edexcel BTEC DIT exam, see here:
This video is primarily designed for the written exam (Component 3: Effective Digital Working Practices) for the Pearson Edexcel BTEC Level 1/2 Tech Award in Digital Information Technology. Video #3 of D1.
For the ordered playlist of videos for the Edexcel BTEC DIT exam, see here:
 0:08:46
Data and Information Flow Diagrams
 0:04:14
Data Flow Diagrams - What is DFD? Data Flow Diagram Symbols and More
 0:08:09
Data Flow Diagrams (DFDs)
 0:19:11
Data Flow Diagram EXAMPLE [How to Create Data Flow Diagrams]
 0:00:48
data flow diagram with chatgpt | DFD with GPT #chatgpt #plantuml #ai #DFD
 0:12:06
5.2 Data Flow Diagrams
 0:08:16
What is DFD? How to design DFD, Symbols, examples full explanation
 0:12:06
Systems Documentation Techniques (AIS Ch 3)
 0:08:28
Chapter 21 | State flow chart appearance
 0:05:56
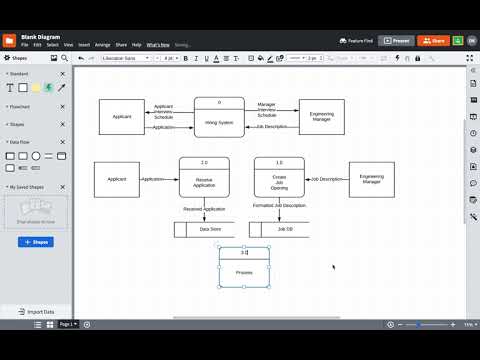
How to create a Level-0 Data Flow Diagram (DFD)
 0:10:58
What is DFD? full Explanation | Software Engineering
 0:09:39
Video Store Database: Dataflow Diagram (1 of 2)
 0:00:15
Microsoft Power BI Data-Flow Diagram
 0:05:35
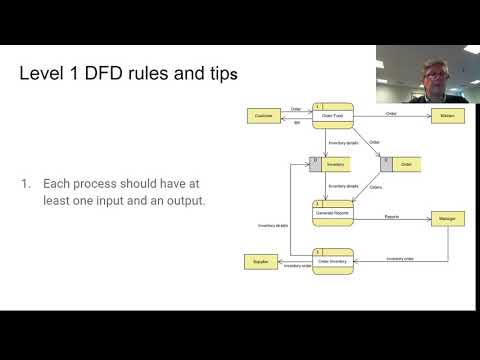
How to create a Level-1 Data Flow Diagram (DFD)
 0:02:18
Software Flowchart
 0:01:27
Data Flow Diagram
 0:14:19
Data Flow Diagram Tutorial
 0:02:10
Data Flow diagrams in Threat Modeling
 0:08:06
How to Make a User Flow Diagram with Example
 0:02:13
Data Flow Diagrams - Simply Put!
 0:05:45
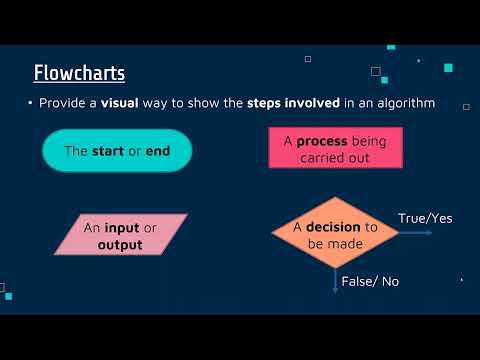
Flowcharts
 0:02:59
System Diagrams
 0:11:11
data flow diagram | software engineering |
 0:06:16
QC101 Process Flow Charting
Комментарии