filmov
tv
Tableau Tutorial -Improved Tables - KPIs, Conditional Formatting, Sparklines (Step-by-Step Tutorial)
Показать описание
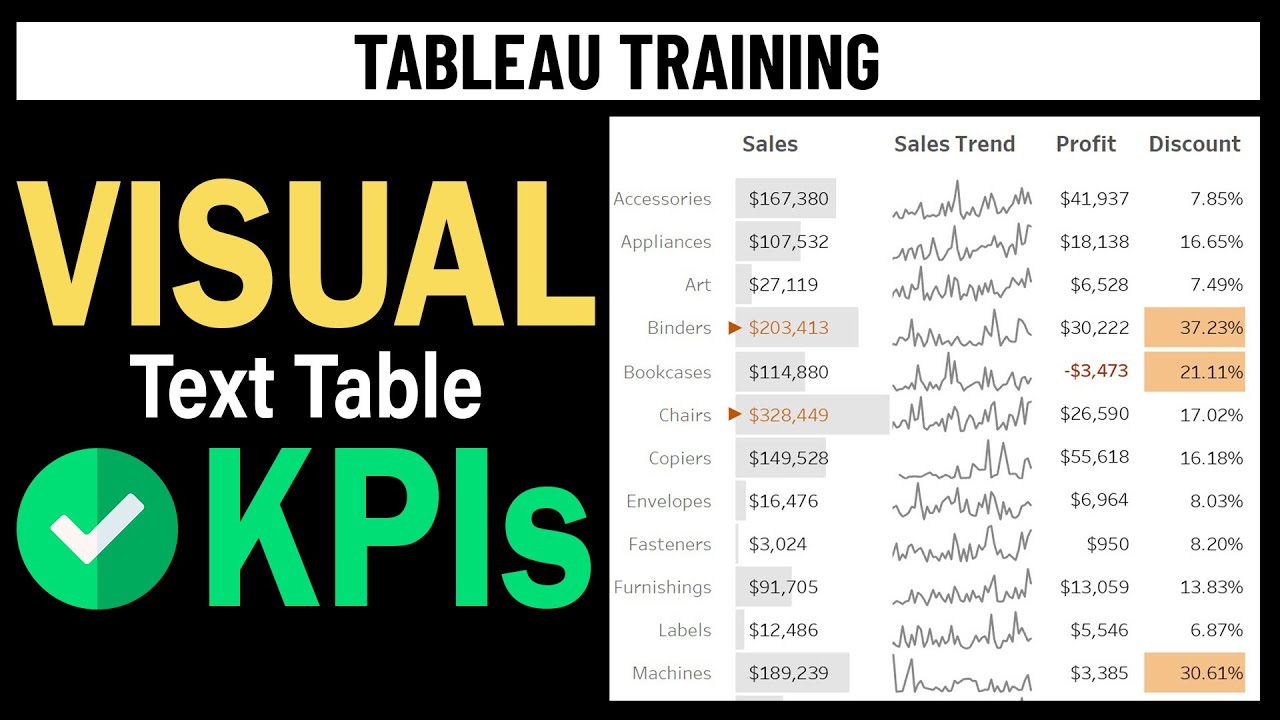
We can improve our text tables by incorporating some visual elements like KPIs, conditional formatting for text color and background, and sparklines. This video walks through 5 common strategies, as well as a number of tips and tricks to enhance tables.
This video uses the Sample Superstore data set, and includes a step-by-step end-to-end tutorial to create a table with:
- embedded bar graph and KPI
- conditionally formatted text color
- conditionally formatted background color
- sparkline
Sections:
0:00 - Intro
1:12 - Simple Text Table in Tableau
2:10 - What we will create (tutorial goal)
3:35 - Strategy #1: Single Measure with Simple KPI - circle
6:04 - Strategy #1: Single Measure with Simple KPI - up and down arrow
9:22 - Important Tip: Axis and Gantt
13:49 - Strategy #2: Conditional Formatting - Text
17:09 - Strategy #2: Conditional Formatting - Background Color
22:52 - Important Tip: Transparent Color
24:12 - Stratagy #3: Embedded Bar with KPI
27:08 - Strategy #4: Sparkline
29:11 - Strategy #5: Putting it all together
35:04 - Pros and Cons
Related Videos:
Basic Calculations - Comprehensive Tutorial
Parameters - Comprehensive Introduction with 10 use cases
Dynamic Up and Down Arrows
Dashboard Tips and Tricks (layout containers)
Dealing with NULL values
Blue vs Green, Discete vs Continuous
15 + 1 Common Tableau Charts
Useful Tableau Shortcuts
Dual Axis Chart (Tip #9)
Formatting Worksheets
Thumbnail Icon/Image Credit
 0:36:07
Tableau Tutorial -Improved Tables - KPIs, Conditional Formatting, Sparklines (Step-by-Step Tutorial)
 0:11:52
Enhance your Tables in Tableau [A Step by Step Guide]
 0:01:00
Create an Advanced Tableau Table
 0:03:47
Webinar Shorts: Tips for Improved Tables in Tableau
 0:11:16
12 Top Tips to Improve Tableau Performance (DataSource)
 0:00:41
How to build a text table with multiple measures in Tableau
 0:08:43
Tableau - How to Create a Text Table
 0:16:32
Tableau - Table Calculations
 0:28:08
Tableau Table Calculations Explained - Complete Tutorial with Examples | sqlbelle
 0:11:31
Make an AWESOME Tableau Dashboard in Only 10 Minutes
 0:04:09
Using Context Filters and Improving Dashboard Performance - Tableau in Two Minutes
 0:10:08
How to Expand and Contract Text Tables in a Tableau Dashboard
 0:17:04
How to Install Tableau and Create First Visualization | Tableau Tutorials for Beginners
 0:10:45
How to enhance your tables in #Tableau Software (EN)
 0:16:11
Learn Tableau in 15 minutes and create your first report (FREE Sample Files)
 0:13:57
Tableau Dashboard Tips [Top 10 Tableau Dashboard Design Tips]
 0:38:55
Tableau Tutorial - Format Worksheets in Tableau - Comprehensive Tutorial for Beginners
 0:04:15
How to add more than 50 columns to a Tableau Table | Long Table in Tableau
 0:09:57
Tableau Tutorial for Beginners 34 - How to Conditionally Format Table Columns
 0:07:03
Tableau - Actions Filter
 2:15:06
Advanced Tableau Training: 2-Hour Expert Course for Tableau Desktop
 0:05:53
Add sparklines in #Tableau, just another way to Enhance Tables
 0:04:56
Tableau - Alignment
 0:02:01
Improved Quick Search - New in Tableau 2022.2
Комментарии