filmov
tv
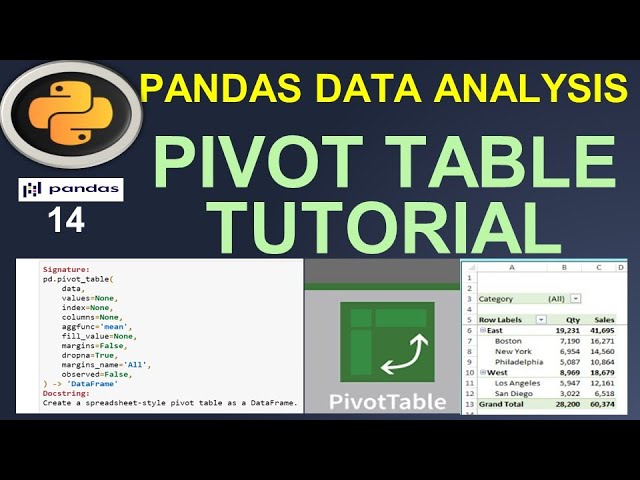
Python Pandas Tutorial: Data Analysis & Visualization With Pivot Table in Pandas#14
Показать описание
Hi Guys, In this video I have talked about how you can create pivot tables with visualization in Python. Pivot table is an very essential concept for data analysis, data wrangling and data pre-processing purpose. With pivot table we can easily summarize our data really fast from any dataset.
Most people likely have experience with pivot tables in MS Excel. Python provides also a same flavor using Pandas. Really using pandas pivot table you can look at your data from a different alignment and pivot extensively used in analyzing or summarizing the data.
This video covers as follows in greater details:
Pandas Pivot Table introduction
Why use Pivot Tables?
Pandas Pivot Table function syntax and parameters.
How to pick specific column in Pivot Table?
How to use aggregate function in Pivot Table?
How to apply multiple aggregate function on a single column in Pivot Table?
How to handle null values in Pivot Table?
How to set the total in each row and column using margins parameter?
How to apply filter in Pivot Table?
How to sort the data in Pivot Table?
How to create pivot table on specific portion of the data?
Use query method and its benefit with Pivot Table?
Create "bar" chart using Pivot Table.
Create "line" chart using Pivot Table.
How to plot sales month wise (extract month name from date column) and visualize it?
*More!!!
Always looking for your valuable suggestion on what kind of videos you want in future, leave me a comment with your suggestion. Keep watching!!!
 0:23:01
Python Pandas Tutorial (Part 1): Getting Started with Data Analysis - Installation and Loading Data
 0:22:50
Learning Pandas for Data Analysis? Start Here.
 1:00:27
Complete Python Pandas Data Science Tutorial! (Reading CSV/Excel files, Sorting, Filtering, Groupby)
 1:34:11
Complete Python Pandas Data Science Tutorial! (2025 Updated Edition)
 0:32:13
Exploratory Data Analysis in Pandas | Python Pandas Tutorials
 0:53:22
Python Pandas Tutorial | Pandas For Data Analysis | Python Pandas | Python Tutorial | Simplilearn
 1:50:25
Python Pandas Full Tutorial for Beginners | Data Science | Data Analysis | Data Manipulation @SCALER
 0:00:37
Python PANDAS for Beginners | Data Analysis Made Easy #coding #pythonlearning #pythonprogramming
 0:00:56
Pandas Basics: Quick Python Tutorial
 0:18:18
Learn how to use PANDAS in Python in 15 minutes - with 10 real examples
 0:17:42
Pandas Tutorial Italiano 🧑🏻💻 Python per la Data analysis e Data Science 📊 Diventa Data Analyst!...
 0:13:31
LEARN PANDAS in about 10 minutes! A great python module for Data Science!
 0:00:43
How to learn Python fast for data analysis? #dataanalyst #python #pandas #numpy #matplotlib
 0:20:58
Python Pandas Tutorial 2: Dataframe Basics
 4:22:13
Data Analysis with Python - Full Course for Beginners (Numpy, Pandas, Matplotlib, Seaborn)
 1:06:27
Pandas Full Python Course - Data Science Fundamentals
 0:09:23
Python Pandas Tutorial 1. What is Pandas python? Introduction and Installation
 0:23:06
Pandas for Data Science in 20 Minutes | Python Crash Course
 0:40:22
Exploratory Data Analysis with Pandas Python
 0:12:05
Python Pandas tutorial | Data analysis | Part - 1
 2:14:29
NumPy and Pandas Tutorial | Data Analysis With Python | Python Tutorial for Beginners | Simplilearn
 4:57:59
Pandas & Python for Data Analysis by Example – Full Course for Beginners
 0:05:55
NumPy vs Pandas
 1:13:03
Pandas for Data Analysis In Python | Sagar Chouksey | Part-1
Комментарии