filmov
tv
RSI indicator trading strategy, Part 1

Показать описание
RSI indicator trading strategy for Forex, stocks and E-minis.
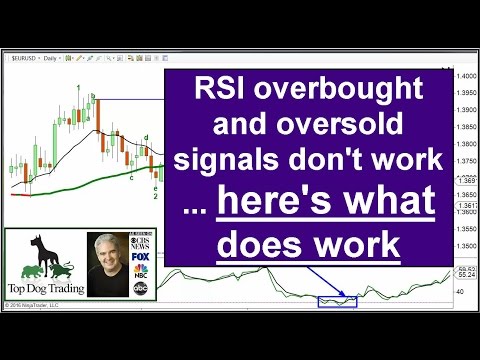
The RSI indicator and other "bounded indicators" are often mistakenly traded as buy signals when they're oversold and as sell signals when they're overbought. This is exactly the opposite of what works!
Enjoy the video! Leave your questions and comments below!
Make sure not to miss a single video from Barry! Click here to Subscribe:
====================================================
Barry Burns
Top Dog Trading
Get the Free Trade Strategy: “The Rubber Band Trade”:
===================================================
Watch the related video: "Forex Trading Strategies: Enter When Time and Price Come Together:"
---
---
RISK DISCLAIMER:
The information contained on this video is for informational and educational purposes only. We are not registered as a securities broker-dealer or as investment advisers, either with the U.S. Securities and Exchange Commission or with any state securities regulatory authority. We are neither licensed nor qualified to provide investment advice. Trading and investing involves substantial risk. Financial loss, even above the amount invested, is possible. Seek the services of a competent professional person before investing or trading with money.
The information contained on this video, is not provided to any particular individual with a view toward their individual circumstances and nothing in this video should be construed as investment or trading advice. Each individual should assume that all information contained on this site is not trustworthy unless verified by their own independent research.
Any statements and/or examples of earnings or income, including hypothetical or simulated performance results, are solely for illustrative purposes and are not to be considered as average earnings. Prior successes and past performance with regards to earnings and income are not an indication of potential future success or performance.
You should never trade with money you cannot afford to lose. The information in this video is in no way a solicitation of any order to buy or sell. The author and publisher assume no responsibility for your trading results.
This information is provided "AS IS," without any implied or express warranty as to its performance or to the results that may be obtained by using the information.
Factual statements in this site are made as of the date the information was created and are subject to change without notice.
HYPOTHETICAL OR SIMULATED PERFORMANCE RESULTS HAVE CERTAIN INHERENT LIMITATIONS. UNLIKE AN ACTUAL PERFORMANCE RECORD, SIMULATED RESULTS DO NOT REPRESENT ACTUAL TRADING. ALSO, SINCE THE TRADES HAVE NOT ACTUALLY BEEN EXECUTED, THE RESULTS MAY HAVE UNDER- OR OVER-COMPENSATED FOR THE IMPACT, IF ANY, OF CERTAIN MARKET FACTORS, SUCH AS LACK OF LIQUIDITY. SIMULATED TRADING PROGRAMS IN GENERAL ARE ALSO SUBJECT TO THE FACT THAT THEY ARE DESIGNED WITH THE BENEFIT OF HINDSIGHT. NO REPRESENTATION IS BEING MADE THAT ANY ACCOUNT WILL OR IS LIKELY TO ACHIEVE PROFITS OR LOSSES SIMILAR TO THOSE SHOWN.
 0:07:46
RSI indicator trading strategy, Part 1
 0:03:56
RSI Indicator Trading Strategy (Advanced)
 0:08:15
RSI indicator trading strategy, Part 3
 0:02:48
RSI Trading Strategy Relative Strength Index
 0:10:06
RSI indicator trading strategy, Part 2
 0:01:00
Why You Are Using The RSI Indicator WRONG #shorts
 0:44:00
Best RSI Indicator Trading Strategy - Wysetrade Method
![[Free Guide] |](https://i.ytimg.com/vi/6bN0fGltKvM/hqdefault.jpg) 0:03:45
0:03:45
[Free Guide] | RSI Strategies and Calculation
 0:02:15
Rsi Indicator || Rsi Trading Strategy || Rsi || Indicator
 0:42:47
The Only RSI Indicator Trading Video You Will Ever Need... (Beginners Guide)
 0:24:30
RSI & Stochastics Indicator Strategy for Profits in Intraday Trading | Learn Technical Analysis ...
 0:00:29
stochastic rsi trading strategy #shorts
 0:19:08
You are Using the RSI Indicator WRONG! (RSI Trading Strategy Secrets REVEALED)
 0:00:56
Why You Are Using The RSI WRONG
 0:16:24
My 4 favorite RSI strategies + secrets that work
 0:21:28
RSI Indicator Secrets: Powerful Trading Strategies to Profit in Bull & Bear Markets
 0:21:25
The ONLY RSI Trading Strategy That PERFECTLY Times Market Reversals...
 0:12:03
4 Best RSI Trading Strategy in Share Market | RSI Indicator For Technical Analysis of Stocks
 0:09:06
Beginner Guide to the RSI Indicator
 0:04:22
How to Use the Relative Strength Index (RSI)
 0:00:12
How To Trade RSI Indicator | RSI Divergence Trading Setup | Trading Strategies | Forex | Trading |
 0:01:01
Buy or Sell? RSI Indicator Trading Strategy #forextradingtips #forexsignals
 0:16:38
RSI Divergence Strategy | When to Buy & Sell Indicator | Reversal Trade Forex /Crypto/Stock Mark...
 0:13:46
REVEALED: The Secret RSI Indicator Trading Strategy (RSI Trading MADE EASY)
Комментарии