filmov
tv
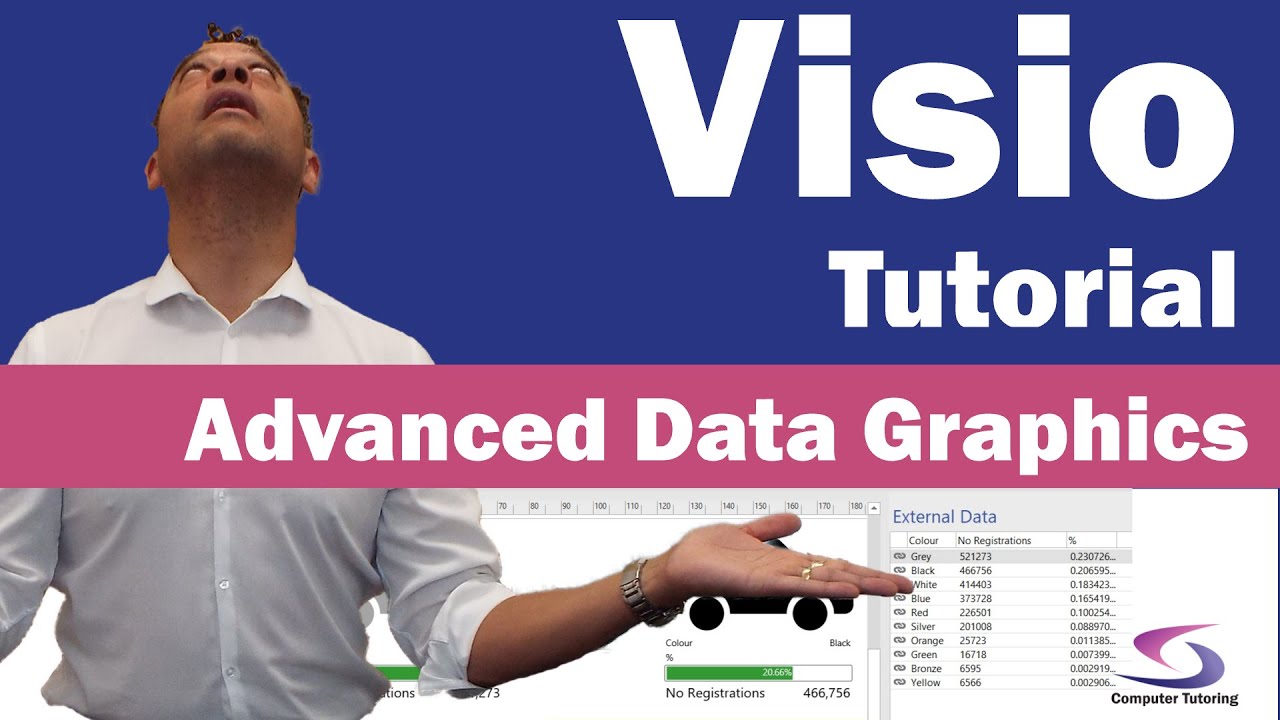
Visio Tutorial on Advanced Data Graphics
Показать описание
This Visio tutorial on advanced data graphics will show you how to link an Excel spreadsheet to a Visio drawing, then display data graphics in Visio that will make your boring Excel spreadsheet more engaging.
This Visio data graphics tutorial will also show you how linking data to your Visio drawing will allow you to change the colour of a shape based on values in your Excel spreadsheet.
During this Microsoft Visio data graphics tutorial you will also see tips on getting your data to update.
Chapters
00:00 - Intro
02:06 - Get Started
03:39 - Having a look at the Excel spreadsheet
04:05 - Convert data in spreadsheet to a Table
06:05 - Import the Excel table into Visio
07:20 - Linking the Excel data to shapes
08:30 - Refreshing the Excel data
11:55 - Arrange the data graphics
13:25 - Customising shapes in data graphics
15:27 - Number formatting in Visio data graphics
16:10 - Percentage formatting (Remember to change max value to 1 or check link below).
17:15 - Change colour of graphic based on value from a spreadsheet
19:40 - Eating a fly
20:10 - Apply formatting to multiple graphics
20:30 - Making the Visio page look pretty
Advanced Data Graphics exercise file
Update that solves why 23% is filling more than half the progress bar.
#computertutoring
😊 Check out my website and social media to keep up to date - enjoy learning 😊
 0:21:49
Visio Tutorial on Advanced Data Graphics
 0:46:40
Visio 2021 Advanced Tutorial
 0:05:57
How to use a data graphic in Microsoft Visio 2024
 0:12:57
Microsoft Visio - Tutorial for Beginners in 13 MINUTES! [ FULL GUIDE ]
 0:02:06
Microsoft Visio Tutorial - Advanced Theme options
 1:42:51
Visio 2021 Full Course Tutorial
 0:10:27
Unlocking Visio Shape Data & Data Graphics
 0:03:27
Microsoft Visio Tutorial - Advanced Formatting for Shapes
 0:14:51
How to use Microsoft Visio
 0:05:49
Visio for Excel - Create Flowcharts Linked to Cells
 0:14:05
Microsoft Visio - Tutorial for Beginners in 14 MINS! [ COMPLETE GUIDE ]
 1:33:44
Visio 2019 Advanced Tutorial
 0:02:59
Microsoft Visio 2016 Tutorial: BEGINNER to ADVANCED fast!! - learn Microsoft Visio
 0:06:20
Visio Data Visualizer: How to automatically create process diagrams from Microsoft Excel data
 0:56:42
Visio 2021 Beginner Tutorial
 0:09:48
7.2 Creating Visio Shape Data Fields
 0:02:07
Visio advanced data graphic
 0:17:12
Building a Network Diagram Using Microsoft Visio 2021
 0:02:05
What is Visio Data Visualizer
 0:05:28
Visual Overview - Visio App Basics - Advanced editing
 0:12:12
🔥 Microsoft Visio Professional 2021 - 10 Awesome New Features
 0:07:36
Linking Images to Excel Data in Microsoft Visio | Microsoft Visio Tutorials
 0:01:42
Visio Data Linking Tutorials
 0:00:11
Add data to chart in excel #exceltips #exceltutorials #charts
Комментарии