filmov
tv
Pre-Calculus Prep: Graphing Parametric Equations x=5sint, y=4cost (Ellipse)
Показать описание
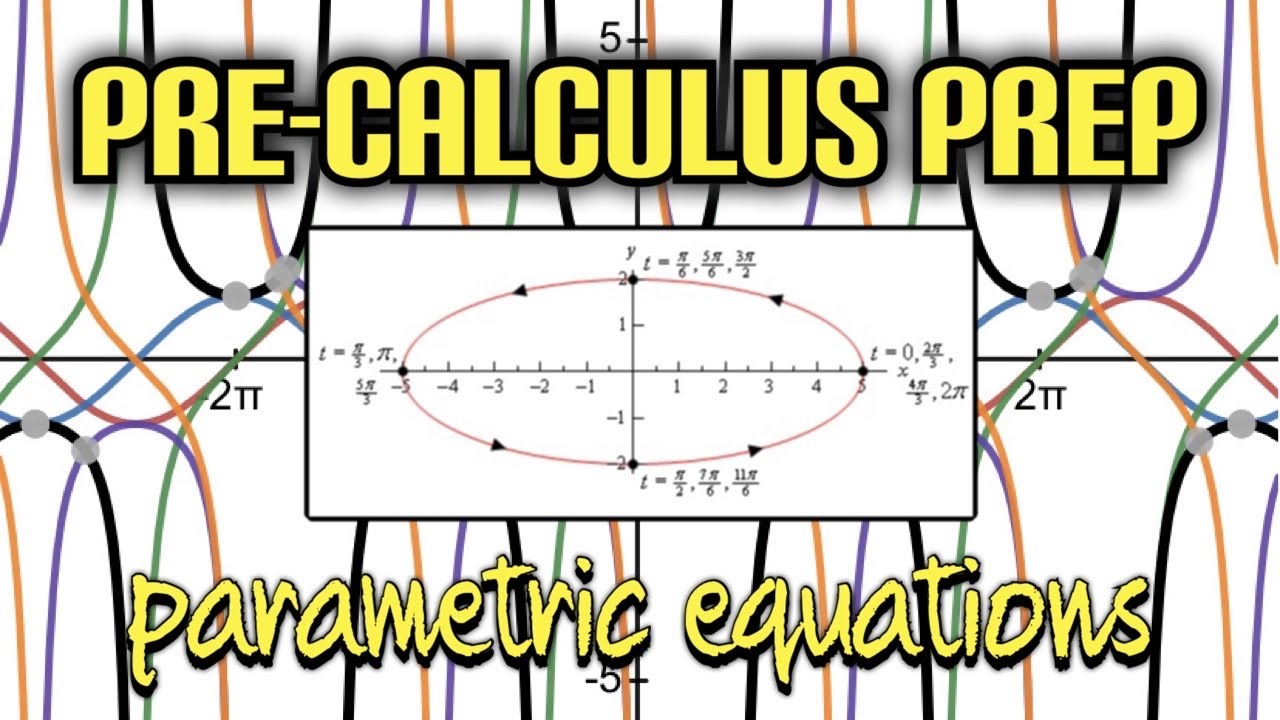
In pre-calculus, graphing parametric equations allows us to visualize curves and shapes by expressing the coordinates of points on the graph as functions of a third variable, usually denoted as 't'. Let's explore the parametric equations x = 5sin(t) and y = 4cos(t), which represent an ellipse.
1. Identify the variables: In this case, we have the variables x and y, which represent the coordinates of points on the graph.
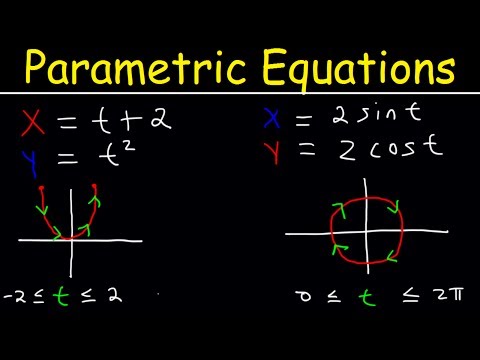
2. Plotting points: To graph the ellipse, we need to substitute different values of 't' into the parametric equations and plot the corresponding (x, y) pairs on a coordinate plane. Choose a range of values for 't' that will give you a good representation of the shape of the curve. Since the sine and cosine functions have a period of 2π, a common range is 0 ≤ t ≤ 2π.
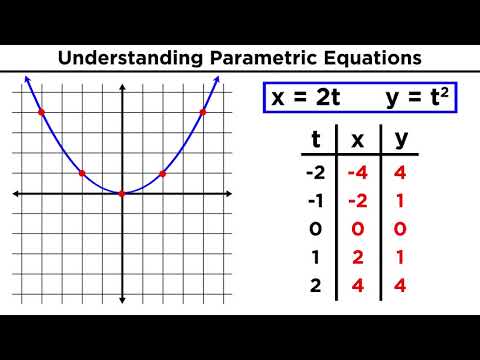
3. Table of values: Create a table to organize the values of 't', 'x', and 'y'. For example:
| t | x | y |
|-------|---------------|---------------|
| 0 | 0 | 4 |
| π/4 | 5/√2 ≈ 3.54 | 4/√2 ≈ 2.83 |
| π/2 | 5 | 0 |
| 3π/4 | 5/√2 ≈ 3.54 | -4/√2 ≈ -2.83|
| π | 0 | -4 |
|5π/4 | -5/√2 ≈ -3.54| -4/√2 ≈ -2.83|
|3π/2 | -5 | 0 |
|7π/4 | -5/√2 ≈ -3.54| 4/√2 ≈ 2.83 |
4. Plotting the points: Using the values from the table, plot the corresponding (x, y) pairs on the coordinate plane. Each point represents a specific value of 't' on the curve. Connect the points smoothly to obtain the shape of the ellipse.
5. Shape of the ellipse: By connecting the points, you will observe that the graph forms a symmetrical ellipse centered at the origin (0, 0). The major axis of the ellipse is along the x-axis, with a length of 10 (2 times the amplitude of the x-coordinates). The minor axis is along the y-axis, with a length of 8 (2 times the amplitude of the y-coordinates).
6. Optional: If desired, you can add additional points by selecting more values of 't' and calculating the corresponding (x, y) pairs. This will help in getting a clearer picture of the shape and any important features of the ellipse.
Remember to label the axes, indicate any relevant coordinates or points on the graph, and use a suitable scale for your coordinate plane.
By following these steps and plotting the points obtained from the parametric equations x = 5sin(t) and y = 4cos(t), you can graph an ellipse in pre-calculus.
These videos are designed to review and reteach Precalculus and Collegeboard Pre-CALC AP content. My videos cover functions, polynomials, exponential and logarithmic expressions, trigonometry, parametric equations, polar coordinates, vectors, matrices and systems, conic sections, discrete mathematics, sequences and series; and an introduction to calculus.
Nick Perich
Norristown Area High School
Norristown Area School District
Norristown, Pa .
.
.
#math #maths #mathskills #mathsucks #mathstudent #mathsmemes #mathstudents #mathsteacher #mathsisfun #gcsemaths #quickmaths #mathstutor #mathsclass #mathstricks #mathsjokes #brunomathsson #mathstations #mathslover #mathsproblems #mathsfun #alevelmaths #earlymaths #mathsquiz #mathsmeme #mathsmock #mathsnotes #mathsbeauty #ilovemaths #lovemaths #addmaths #mathsforlife #mathsweek #mathsgames #mathsexam #eyfsmaths #mathsrevision #primarymaths #ihatemaths #mathslesson #mathstuition
 0:33:29
 0:04:53
 0:13:21
 0:04:36
 0:22:06
 0:15:40
 0:06:37
 0:26:02
 1:09:49
 0:38:30
 0:13:17
 0:17:50
 0:17:51
 0:20:00
 0:05:46
 0:14:56
 0:24:28
 1:38:26
 2:02:30
 0:14:34
 0:09:51
 0:03:12
 0:00:09
 0:00:37