filmov
tv
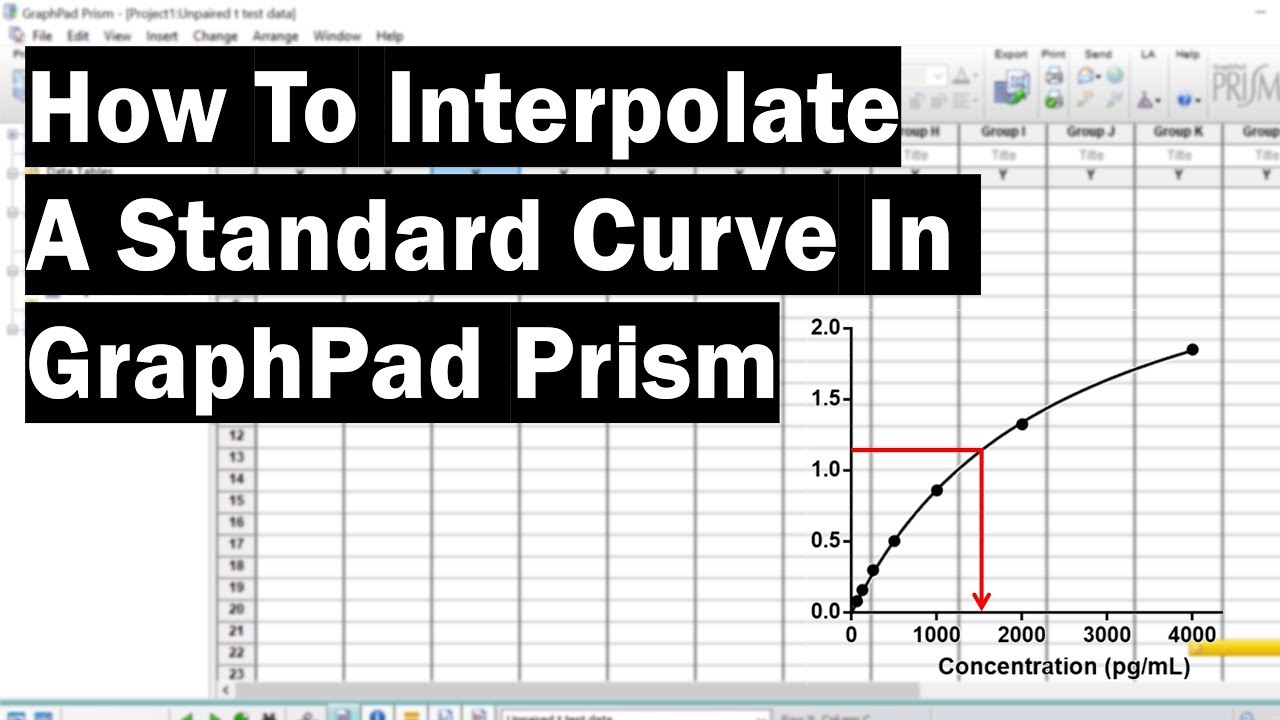
How To Interpolate A Standard Curve In GraphPad Prism
Показать описание
In this video tutorial, I will show you how to interpolate a standard curve by using GraphPad Prism.
In the example, I have performed an ELISA experiment where I need to calculate the concentrations of my samples with known absorbance values, through the use of a standard curve. The standard curve in this example is that of a hyperbola relationship.
GraphPad Prism version used: 6
THE ONLINE GUIDE
MORE HELPFUL HINTS & TIPS
FOLLOW US
 0:04:07
How To Interpolate A Standard Curve In GraphPad Prism
 0:05:28
How to do the 'Interpolation' ??
 0:15:00
Interpolation
 0:08:59
Interpolation and Extrapolation: Estimating Values from a Graph
 0:02:52
Casio Classwiz FX 991EX Linear Interpolation Step by Step Tutorial
 0:01:00
Simple interpolation fx-991ES Plus
 0:04:55
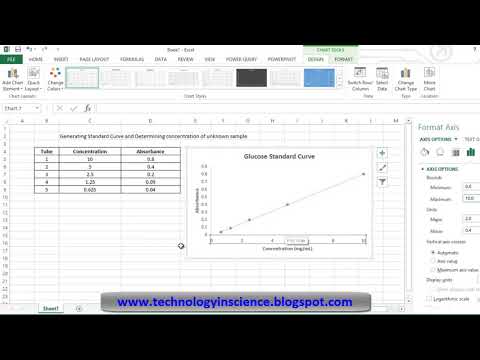
Generating Standard Curve and Determining Concentration of Unknown Sample in Excel - Simple Method
 0:16:47
Interpolate with Excel | FORECAST function can interpolate | Excel Off The Grid
 0:02:42
How to calculate Protein Concentration of Unknown Sample from standard curve in excel
 0:10:24
Interpolation | Lecture 43 | Numerical Methods for Engineers
 0:11:46
STATISTICS, LINEAR INTERPOLATION
 0:05:46
How to Interpolate in Excel (Equation, FORECAST, TREND)
 0:20:18
HOW TO INTERPOLATE WITH TIDE TABLES & NAUTICAL ALMANAC
 0:12:38
How to interpolate (x,y) data points in Excel and Google Sheets with INTERPXY()
 0:10:01
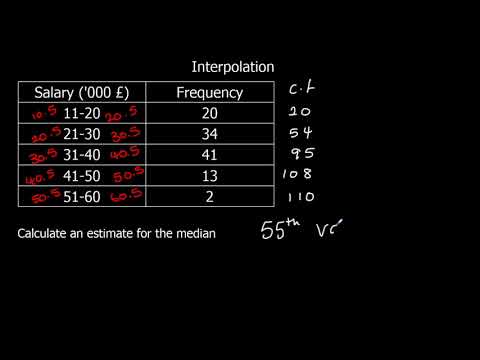
A-Level Maths: L3-05 [Data: Estimating the Median from Grouped Data]
 0:01:34
Mathematics: Origin 9: Interpolate X or Y
 0:06:34
Using Standard Curve to solve for Unknown Concentration
 0:07:32
GraphPad prism tutorial #1 - Graphing Standard curve and interpolating unknowns
 0:05:41
S1 median by interpolation
 0:08:11
Lagrange Interpolating Polynomial - Easy Method
 0:00:33
How to Extrapolate Excel Graph
 0:02:13
How to solve the interpolation in calculator | Casio fx991 MS | The calculator King
 0:05:26
Double interpolation by using calculator | quick steps
 0:01:38
Linear Interpolation by CASIO fx-991ES Scientific Calculator.
Комментарии