filmov
tv
Climate Scientists Are Deceiving You!

Показать описание
Join us today as we dismantle a claim against the graphs that climate scientists present. Oh, and stay tuned to learn why increased CO2 levels isn't necessarily good for plants.
-------------------------------------------------------------------------------------------------
♫ Finn and Jake, by WVLF and Uth Fruit
FAIR USE NOTICE:
This video may contain copyrighted material the use of which has not always been specifically authorized by the copyright owner. We are making such material available in our efforts to advance understanding of environmental, political, human rights, economic, democracy, scientific, and social justice issues, etc. We believe this constitutes a 'fair use' of any such copyrighted material as provided for in section 107 of the US Copyright Law. In accordance with Title 17 U.S.C. Section 107, the material on this site is distributed without profit to those who have expressed a prior interest in receiving the included information for research and educational purposes.
 0:10:43
Climate Scientists Are Deceiving You!
 0:05:20
Global warming: why you should not worry
 0:01:31
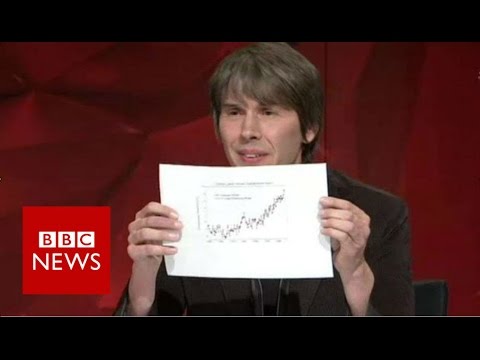
Climate Change: Professor Brian Cox clashes with sceptic Malcolm Roberts - BBC News
 0:14:02
The Climate Change Conspiracy... Conspiracy | Anjali Appadurai | TEDxSurreySalon
 0:02:40
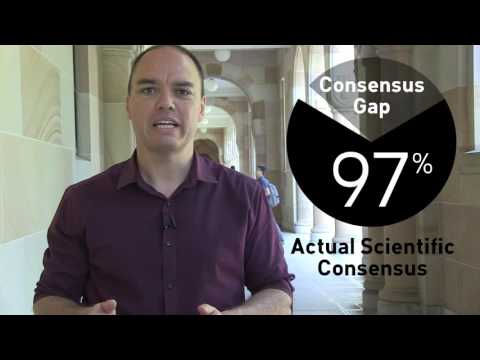
Scientists are 95% sure humans are causing climate change
 0:18:50
Climate change: 'The deadliest weather is extreme heat,' says climate scientist
 0:03:23
Freeman Dyson: Climate Change Predictions Are 'Absurd' | Freeman J. Dyson | Big Think
 0:09:02
The Biggest Lie About Climate Change
 1:00:32
'Dispelling climate change myths—how ocean physics explains surprises in the current climate re...
 0:04:20
The research agrees: Humans are causing climate change (consensus on consensus)
 0:06:44
David Attenborough & Tim Flannery on Climate Change
 0:02:33
Scientists Warn Climate Change Will Bring More Triple-Digit Heat To Bay Area Cities
 0:05:51
11,000 scientists warn of climate emergency and demand radical action | DW News
 0:06:31
The Truth About Climate Change
 0:01:11
Trump reiterates his climate change doubts: 'Show me the scientists'
 1:12:11
Known Unknowns or Unknown Unknowns? Uncertainty in Climate Change Projections & How to Handle Th...
 1:16:52
THINKClima 2021 Conference panel “Fighting climate misinformation”
 0:15:28
AGU Chapman Conference -- Climate Science: Melanie Fitzpatrick
 0:09:58
Why have climate change predictions been so WRONG?
 0:06:08
Study assesses economic impact of global warming by individual countries
 0:00:27
How to Answer Any Question on a Test
 0:02:30
Climate scientist Michael Mann: Media needs to 'fix the headline' on climate change
 1:27:30
Climate Data: Mysteries, wonders, and reality
 0:58:51
THINKClima 2021 Conference panel “The climate countermovement in the USA”
Комментарии