filmov
tv
Draw Plot with Confidence Intervals in R (2 Examples) | geom_errorbar [ggplot2] & plotCI [plotrix]

Показать описание
R code of this video:
y = runif(10, 10, 20),
lower = runif(10, 0, 10),
upper = runif(10, 20, 30)), 2)
library("ggplot2")
ggplot(data, aes(x, y)) + # ggplot2 plot with confidence intervals
geom_point() +
geom_errorbar(aes(ymin = lower, ymax = upper))
library("plotrix") # Load plotrix
plotCI(x = data$x, # plotrix plot with confidence intervals
y = data$y,
li = data$lower,
ui = data$upper)
Follow me on Social Media:
 0:03:45
Draw Plot with Confidence Intervals in R (2 Examples) | geom_errorbar [ggplot2] & plotCI [plotri...
 0:02:01
Confidence Interval graph explained
 0:05:34
Confidence Interval [Simply explained]
 0:06:59
How To...Calculate the Confidence Interval for a Sample
 0:12:06
Microsoft Excel - Forest Plots (Odds Ratios and Confidence Intervals)
 0:02:31
How to add 95% confidence intervals to a scatter plot in Excel
 0:14:07
How to plot prevalence and add 95% confidence interval in bar chart?
 0:12:13
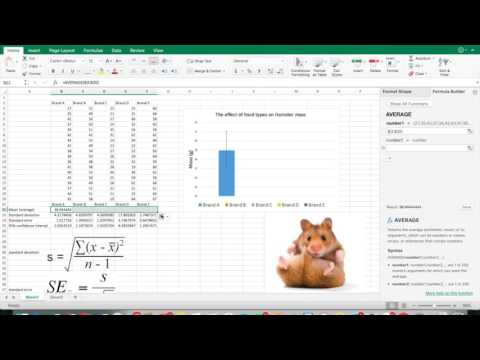
How to add 95% confidence intervals to bar graphs in Excel
 3:04:50
R programming data visualization with ggplot2
 0:06:26
How to Add Standard Deviation or Confidence Interval Options in an Excel Bar Graph
 0:06:48
Tableau Confidence Interval for Line Plot Tutorial
 0:01:00
Confidence Interval for mean in Excel z & t (summary values)
 0:10:37
Using Google Sheets to Calculate 95% Confidence Intervals and Graph Data with Error Bars
 0:03:13
Add Confidence Band to ggplot2 Plot in R (Example) | Draw Interval in Graph | geom_ribbon() Function
 0:02:48
Interpreting Confidence Intervals EXPLAINED in 3 Minutes with Examples
 0:14:14
R Tutorial - ggplot2: Line graphs and scatterplots with confidence intervals
 0:16:03
making confidence interval on excel
 0:06:24
Putting confidence intervals around a mean in a line chart - Excel
 0:09:12
How To Create A Forest Plot In Excel (Odds Ratios)
 0:01:59
Curve Fitting: Origin 9: Report Confidence Interval for New XY Values
 0:06:39
How to Interpret Error Bars
 0:00:31
Plot Mean and SD of data as Bar plot with error bar
 0:04:49
How To Calculate Confidence Intervals In Excel
 0:03:13
Interval Plot in Origin Pro
Комментарии