filmov
tv
Graphing Frequency: BAR CHARTS for Categorical Data with PARETO Option (3-4)

Показать описание
Bar graphs (a.k.a. Bar Charts) are graphical displays used for graphing categorical data. Adjacent bars do not touch (like prison bars): implying the data are not “connected”. The categorical data (variable labels or names of each class in the variable) are placed on the X-axis. The measure of amount, relative frequency, or percent frequency is displayed on the Y-axis. Pareto Chart (a.k.a. Pareto Diagram) is a type of bar chart used with nominal categorical data that arranges the frequency bars in descending order
Chapters
0:00 Basic bar graphs
1:48 Pareto chart options
▀▀▀▀▀▀▀▀▀▀▀▀▀▀▀▀▀▀▀▀▀▀▀▀▀▀
This video is part of a series for an introductory statistics course. It supports an academic course QBA 237 Basic Business Statistics at Missouri State University, College of Business, Department of Information Technology and Cybersecurity. Posted beginning in August 2022.
This series was designed, written, produced, recorded, edited, and posted by Dr. Todd Daniel, a Ph.D. statistician and researcher with extensive experience in academic statistical research and statistics instruction. Dr. Daniel directed a research institute for many years before doing private consulting for Research by Design, LLC. He remains active in teaching and research.
▀▀▀▀▀▀▀▀▀▀▀▀▀▀▀▀▀▀▀▀▀▀▀▀▀▀
Statistics Instructors: you are free to link to this video and the playlist for your seated or online statistics course or for other educational purposes.
Edited on Mac in Final Cut Pro and Camtasia 2022
Music: Digital Juice Royalty Free Music
▀▀▀▀▀▀▀▀▀▀▀▀▀▀▀▀▀▀▀▀▀▀▀▀▀▀
To download, hover your cursor over the file icon and a blue download icon will appear. You do not need to request access to a file.
 0:03:30
Graphing Frequency: BAR CHARTS for Categorical Data with PARETO Option (3-4)
 0:07:36
Bar Chart, Pie Chart, Frequency Tables | Statistics Tutorial | MarinStatsLectures
 0:07:35
Bar Charts, Pie Charts, Histograms, Stemplots, Timeplots (1.2)
 0:01:55
How a histogram is different than a bar chart?
 0:08:39
Frequency Distribution Graphs ~ Shape of a Distribution
 0:01:29
Creating a Frequency Bar Graph Using Excel
 0:03:59
Frequency Tables and Bar Graphs
 0:00:17
Bar graph of grouped data #graphs #chapter17 #nsm2 #groupeddata #ungroupeddata #frequency #d2 #maths
 0:05:38
What is Histrogram ? How to create/make a Histogram | Explained with animated example
 0:07:49
Bar Charts and Bar Graphs Explained
 0:07:46
Bar graphs, histograms, and frequency polygons, Oh my!
 0:08:13
How to draw a Bar Chart from a frequency Table
 0:07:16
Stata Tutorial: Frequency Distributions and Associated Graphs (Pie Charts and Bar Graphs)
 0:04:18
Statistics Chapter Histograms, Line Graphs, and Bar Charts
 0:08:41
Frequency Tables, Bar Charts, Pie Charts, Histograms, Grouped & Ungrouped Data Distributions
 0:14:54
Frequency Tables and Bar Graphs
 0:05:20
Drawing a bar graph from the given data - 4th grade math
 0:06:42
Maths Tutorial: Frequency Histograms and Bar Charts (1of3)
 0:01:48
Bar Charts for Continuous Data | GCSE Maths | Mr Mathematics
 0:00:16
Draw Bar Graph | Easy drawing | #drawings #shorts
 0:01:05
Bar Graph of Grouped Data
 0:17:30
Frequency Tables, Bar Graphs, and Pie Charts 2020
 0:00:16
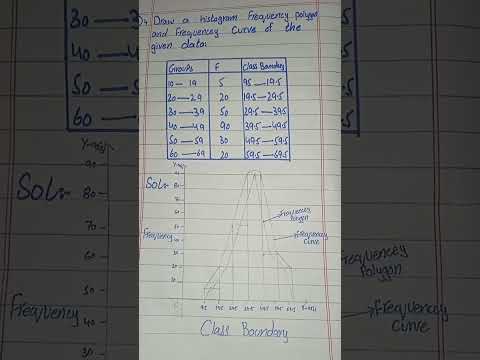
histogram frequency polygon and frequency curve ||
 0:08:19
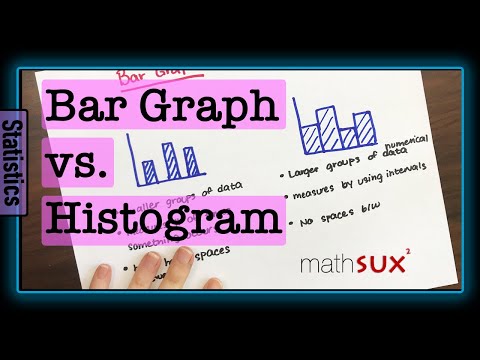
Difference Between Bar Graph and Histogram
Комментарии