filmov
tv
14. Causal Inference, Part 1

Показать описание
MIT 6.S897 Machine Learning for Healthcare, Spring 2019
Instructor: David Sontag
Prof. Sontag discusses causal inference, examples of causal questions, and how these guide treatment decisions. He explains the Rubin-Neyman causal model as a potential outcome framework.
License: Creative Commons BY-NC-SA
Instructor: David Sontag
Prof. Sontag discusses causal inference, examples of causal questions, and how these guide treatment decisions. He explains the Rubin-Neyman causal model as a potential outcome framework.
License: Creative Commons BY-NC-SA
 1:18:43
14. Causal Inference, Part 1
 0:15:32
Causal Inference - EXPLAINED!
 1:18:44
14. Inferencia Causal, Parte 1
 0:34:36
14 - Counterfactuals and Mediation
 1:02:17
15. Causal Inference, Part 2
 0:13:18
Statistical Causal Inference L14 (1/4)
 0:27:39
Causal Inference in Deep Learning (Podcast Overview with Brady Neal)
 0:08:14
1.6 - Course Information (Introduction to Causal Inference)
 1:15:21
Causal Inference, Semiparametric Statistics & Machine Learning in the Age of Data Science
 0:42:11
1 - A Brief Introduction to Causal Inference (Course Preview)
 0:05:44
Introduction to causal inference
 0:02:47
1.1 - Intro and Outline of A Brief Introduction to Causal Inference
 0:16:09
Causal Inference with Machine Learning - EXPLAINED!
 0:29:10
Causal Inference
 0:05:46
Exchangability: Part 1 - Causal Inference
 0:00:54
Causality (and the difference to correlation) Part 2/4 #shorts #dataanalysis #datascience #datatab
 0:19:47
2023 09 14 Causal Inference Symposium Causality Overview
 0:11:58
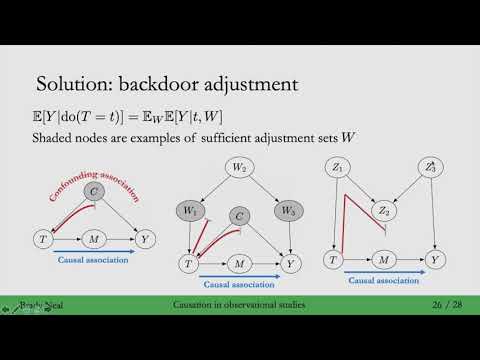
1.5 - Causation in Observational Studies
 0:21:55
Regression Discontinuity Design and Instrumental Variables | Causal Inference in Data Science Part 4
 0:06:23
4.2 - Intervening, the do-operator, and Identifiability
 1:06:38
Causal Inference and AB testing - November 2019
 0:04:03
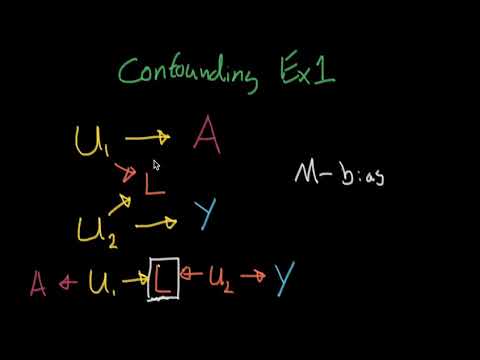
Confounding Example 1 - Causal Inference
 0:03:21
Common Issues in Experiments: Causal Inference Bootcamp
 0:20:20
2023 09 14 Causal Inference Symposium Responsible and Reliable Data Science
Комментарии