filmov
tv
The Kinked Demand Curve Model of Oligopoly Pricing
Показать описание
In our previous lesson on oligopoly, we showed how payoff matrices and game theory could be used to analyze the strategic, interdependent behavior of two firms when deciding the price they would charge. In this lesson we take a graphical approach to oligopoly, and seek to explain why prices tend not to fluctuate up or down in oligopolistic markets.
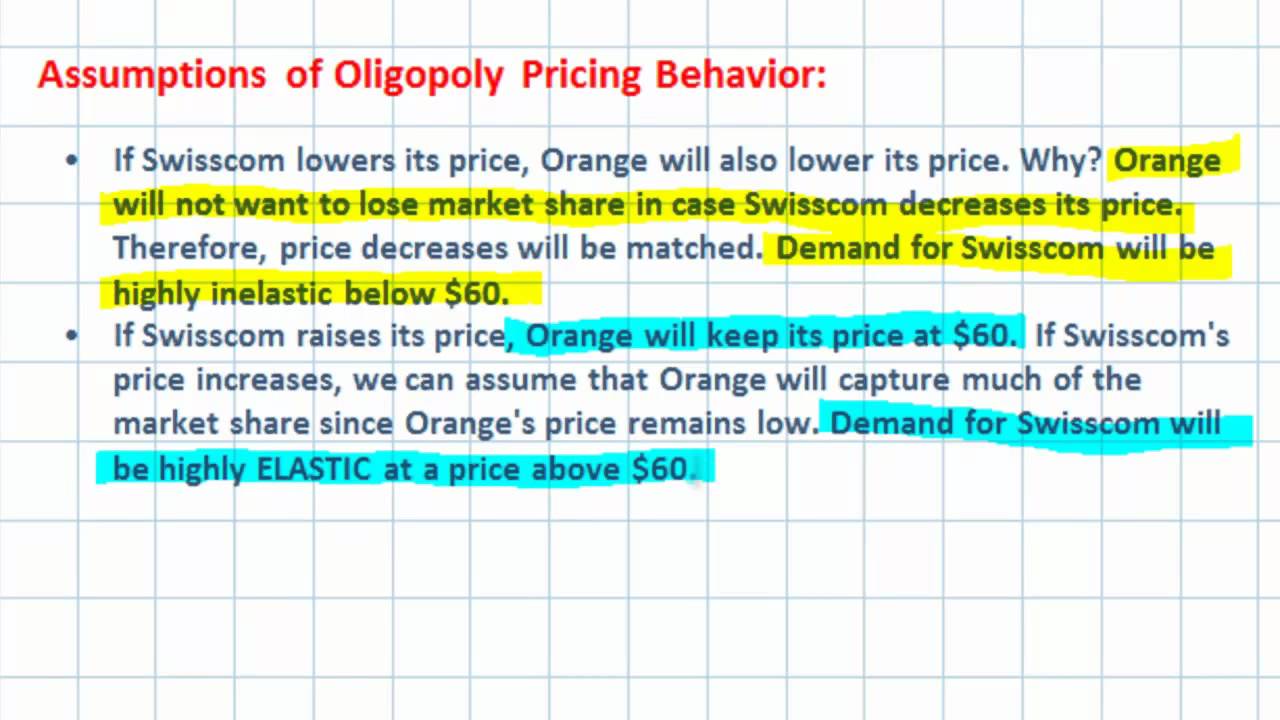
We will look at two firms, Swisscom and Orange, which provide cell service to customers in Switzerland. Why does Swisscom have very little incentive to decrease its prices, and also a strong incentive not to raise its prices? The answer requires us to make assumptions about how the competitor, Orange, would respond to a change in Swisscom's prices.
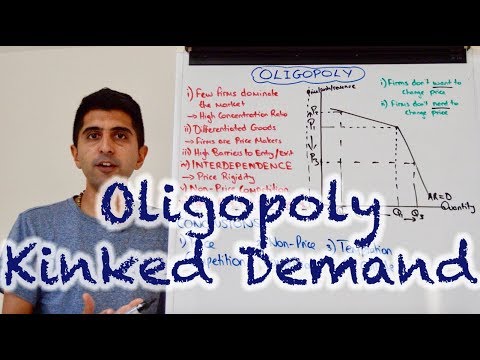
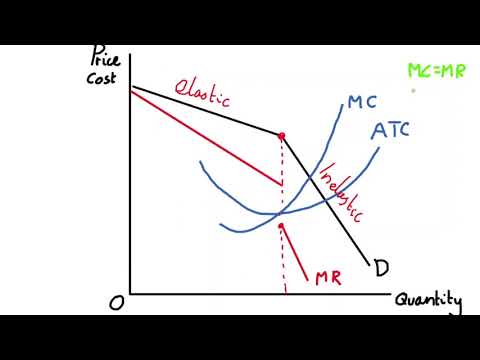
What emerges is a kinked demand curve, highly elastic at prices above the current equilibrium and highly inelastic at prices below the current equilibrium. Along with this kinked demand curve comes a kinked marginal revenue curve, with a vertical section. The implication is that even as an oligopolist's costs rise and fall in the short-run, its level of output and price tends to remain stable.
We will look at two firms, Swisscom and Orange, which provide cell service to customers in Switzerland. Why does Swisscom have very little incentive to decrease its prices, and also a strong incentive not to raise its prices? The answer requires us to make assumptions about how the competitor, Orange, would respond to a change in Swisscom's prices.
What emerges is a kinked demand curve, highly elastic at prices above the current equilibrium and highly inelastic at prices below the current equilibrium. Along with this kinked demand curve comes a kinked marginal revenue curve, with a vertical section. The implication is that even as an oligopolist's costs rise and fall in the short-run, its level of output and price tends to remain stable.
 0:10:40
Y2 23) Oligopoly - Kinked Demand Curve
 0:11:29
Kinked Demand Curve Explained I Oligopoly & Economics
 0:03:49
The kinked demand curve
 0:03:39
5.11 The Kinked Demand Model Equilibrium
 0:04:03
Kinked Demand Curve Model
 0:02:00
Kinked Demand Curve Model of Oligopoly
 0:02:25
A2/IB Why is there a Vertical Discontinuity with Kinked Demand?
 0:10:58
The Kinked Demand Model of Oligopoly
 0:14:06
The Kinked Demand Curve Model of Oligopoly Pricing
 0:03:27
Oligopoly Kinked Demand
 0:06:12
Kinked Demand Curve
 0:04:33
Key Diagrams - The Kinked Demand Curve (Oligopoly)
 0:04:01
Oligopoly Market Structure - Kinked Demand Curve Explained
 0:11:39
Oligopoly and the Kinked Demand Curve by Vidhi Kalra
 0:02:08
Kinked Demand Curve
 0:21:59
Oligopoly& Kinked Demand Curve# Malayalam explanation//FOR degree level STUDENTS.
 0:04:44
5.10 The Kinked Demand Curve
 0:03:48
Sweezy's Kinked Demand Curve Model
 0:01:44
Ruben & Wopke Explain the Kinked Demand Curve
 0:09:45
Kinked demand curve (Oligopoly) || Paul Sweezy Model || Complete guide
 0:12:10
Kinked Demand Curve Oligopoly, Kinked Meaning, kinked demand curve managerial economics, mba, bba
 0:21:23
KINKED DEMAND CURVE MODEL OF OLIGOPOLY. SWEEZY MODEL & HALL & HITCH VERSION.
 0:11:58
Oligopoly - Kinked Demand Model
 0:17:05
Sweezy ‘Kinked’ Demand Curve Model in Hindi
Комментарии