filmov
tv
Prometheus instrumentation: the Practical Way - Aditi Ahuja, Couchbase

Показать описание
Prometheus instrumentation: the Practical Way - Aditi Ahuja, Couchbase
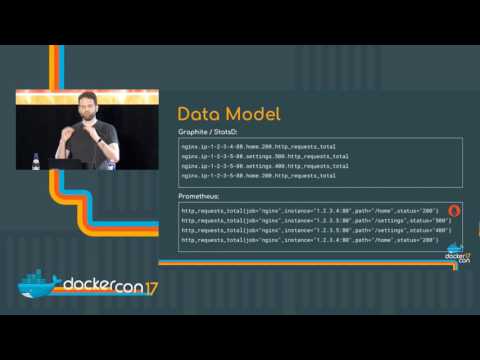
Instrumenting applications to expose meaningful metrics is the key to harnessing the power of Prometheus. The native Prometheus client libraries offer a convenient way to define various metrics about essential behaviours of your application in a form of basic metric types: counters, gauges and histograms. Applying this to more complex cases might be challenging.
In this talk you will learn about the instrumenting real application in an example of Thanos (metric data store extending the long term storage capabilities of Prometheus) compaction microservice. The audience will learn practical instrumentation approaches on production-grade software from basic to more complex cases. The complex case is monitoring various stages and estimating the potential compaction durations, which can vary widely based on the data. Aditi will explain Go client implementation using the official Prometheus library, but the same can be generalized to other languages.
At the end of this talk, you will know how to instrument applications and how to unit test that setup! This talk is for everyone looking to start out with instrumenting code and tap that into Prometheus.
 0:21:54
Prometheus instrumentation: the Practical Way - Aditi Ahuja, Couchbase
 0:10:17
Prometheus Instrumentation
 0:33:03
Auto-instrumentation of Prometheus For RED Monitoring With eBPF - Bartek Płotka & Harshitha Thot...
 0:23:51
Practical Kubernetes Monitoring with Prometheus - Michael Friedrich, GitLab
 0:32:42
Auto-instrumentation of Prometheus for RED Monitorin... Bartlomiej Plotka & Harshitha Chowdary T...
 0:37:53
Instrumenting applications for Prometheus
 0:18:10
Monitoring Using Prometheus | Prometheus Monitoring Ecosystem
 0:22:05
Understanding Prometheus Histograms | Motivation and Concepts, Instrumentation, Querying in PromQL
 0:09:33
Quick start to instrumenting a Rust web app with Prometheus
 0:26:52
PromCon 2018: Anatomy of a Prometheus Client Library
 0:34:55
The RED Method: How To Instrument Your Services [B] - Tom Wilkie, Kausal
 0:55:23
How to instrument Prometheus metrics in GitLab
 0:38:06
A Practical Guide to Prometheus for App Developers [B] - Ilya Dmitrichenko, Weaveworks
 0:40:06
Monitoring, the Prometheus Way
 0:35:38
Instrumenting Applications and Alerting with Prometheus - Simon Pasquier, Red Hat*
 0:32:42
Intro: Prometheus - Matt Layher, Fastly & Ganesh Vernekar, Grafana Labs
 0:11:19
Understanding Prometheus Metric Types | Meaning and Usage (Gauge, Counter, Summary, Histogram)
 0:08:08
Getting Started with Prometheus | Minimal Setup (Download, Config & Run)
 0:13:51
Introduction to Prometheus monitoring
 0:25:46
Observability pre-release: Using Prometheus to test and fix new software - GitHub Universe 2018
 0:04:12
Exposing Custom Host Metrics Using the Prometheus Node Exporter | 'textfile' Collector Mod...
 0:47:14
An introduction to monitoring and alerting with timeseries at scale, with Prometheus
 0:42:10
Prometheus Intro and Deep Dive - Richard Hartmann, Grafana Labs
 0:31:14
Instrument GitLab with Prometheus for Self Monitoring
Комментарии