filmov
tv
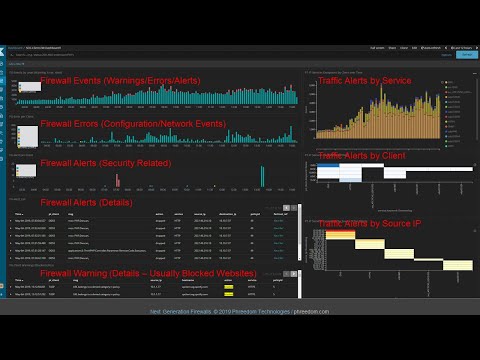
Best SIEM Dashboards - Grafana Install and Dashboard Creation

Показать описание
Join me as we continue on to Phase 6 of the World's Best SIEM Stack Series, installing Grafana and building our first SIEM dashboard!
 0:47:17
Best SIEM Dashboards - Grafana Install and Dashboard Creation
 0:37:33
World's Best SIEM Stack - Build your own Security Stack For FREE! - INTRO
 0:10:41
Wazuh Dashboards in Grafana & Customer Provisioning in CoPilot!
 0:01:13
DX Dashboards: Grafana Upgrade to 7.2.0 - Feb 2021
 0:03:30
Enhanced Reporting with Grafana | Security Spotlight
 0:50:07
Building Security Dashboards on ELK Stack/Elasticsearch to supercharge your SIEM
 1:18:06
Curso SIEM Wazuh Parte 18 Instalação, Criação de Dashboard com Grafana e Zabbix integrado com Wazuh!...
 0:30:19
UX best practices for a dashing dashboard
 0:00:28
Dashboards - DNIF HyperScale SIEM
 0:01:06
2.3.1 Mastering Security Tools: A Deep Dive into Logs, SIEM Dashboards, and Industry Favorites!
 0:13:02
Wazuh Dashboard Creation | Create Dashboard in Wazuh | Wazuh | SIEM | Dashboard | Visualization
 0:12:27
Cosmic Pi 2021- Getting started with Grafana dashboards: Detail
 0:45:19
Taphome Live Config - Grafana Dashboard
 0:14:42
Build a Complete Open Source SIEM Stack in Just Minutes – SOCFortress Fast Track!
 0:39:46
this Cybersecurity Platform is FREE
 0:02:46
Indeni 7.11 - New Grafana Dashboard for FortiGate Devices
 0:07:09
Create Custom PDF Reports in Grafana Detailing Security Events | Share with Your Clients!
 0:02:01
Grafana and CoPilot Integration
 0:47:07
How can we make Grafana a great open source security tool?
 0:47:00
Monitor your Linux Ubuntu webtop with Grafana and Wazuh
 0:07:41
INTRODUÇÃO AO GRAFANA | FERRAMENTA DE OBSERVABILIDADE | MONITORAMENTO | ESTDANDO DEVOPS
 0:06:26
How to create Splunk Dashboard | Cybersecurity
 0:04:53
Best Open-Source Network Monitoring Tools 2024
 0:01:04
I Create Dashboard in One Minute using Python | Python for beginners | #python #coding #programming
Комментарии