filmov
tv
Binding Energy Curve

Показать описание
⦿ Chapter :: Nuclie ⦿ Topic :: Draw Binding Energy Curve ......
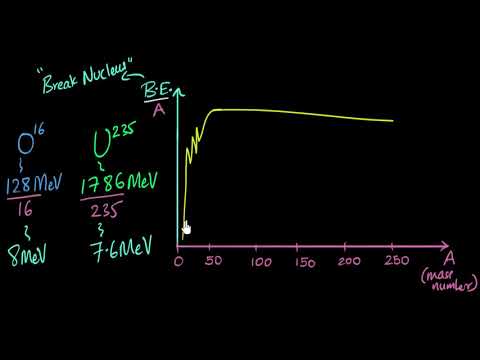
A graph is plotted with the mass number A of the nucleus along the X−axis and binding energy per nucleon along the Y-axis .
The binding energy per nucleon increases sharply with mass number A upto 20. It increases slowly after A = 20. For A less than 20, there exists recurrence of peaks corresponding to those nuclei, whose mass numbers are multiples of four and they contain not only equal but also even number of protons and neutrons. Example: 2He4, 4Be8, 6C12, 8O16, and 10Ne20. The curve becomes almost flat for mass number between 40 and 120. Beyond 120, it decreases slowly as A increases.
The binding energy per nucleon reaches a maximum of MeV at A=56, corresponding to the iron nucleus (26Fe56). Hence, iron nucleus is the most stable.
The average binding energy per nucleon is about 8.5 MeV for nuclei having mass number ranging between 40 and 120. These elements are comparatively more stable and non radioactive.
 0:11:50
 0:13:57
 0:03:21
 0:02:41
 0:11:38
 0:05:57
 0:10:33
 0:14:36
 0:02:00
 0:09:29
 0:19:53
 0:25:13
 0:52:08
 0:06:54
 0:31:00
 0:01:01
 0:14:49
 0:13:59
 0:20:42
 0:28:41
 0:03:01
 0:06:17
 0:18:44
 0:13:59