filmov
tv
Heatmap (Step by Step Tutorial)

Показать описание
Unlock the Power of Heatmaps with Heatmap by Powerviz – Your Ultimate Tool for Stunning Data Visualizations!
Heatmap by Powerviz is an advanced custom visual for Power BI that enables detailed data analysis using Colors, Shapes, and Small Multiples. It allows users to visualize data density or value distribution through color gradients, making complex datasets easy to interpret. Key features include customizable shapes, 30+ color palettes including color-blind safe options, flexible data labels, adjustable axes, and grid lines for enhanced clarity. Additional features include ranking, conditional formatting, reference lines, totals, small multiples, grid view for interactivity, and native Power BI support for cross-filtering and selection.
Join us in this comprehensive walkthrough of Heatmap by Powerviz and learn how to easily visualize and customize data density using colors, shapes, and small multiples to fit your analysis needs. From flexible color palettes to advanced formatting options, this powerful visual offers everything you need to transform complex datasets into clear, actionable insights.
Don't miss out on transforming your Power BI reports with Heatmap by Powerviz – your new go-to tool for professional-grade data visualizations!
Key Features:
Here are the names of the top 10 features:
1. Shapes
2. Data Colors
3. Data Labels
4. Axis Settings
5. Plot Area
6. Reference Lines
7. Ranking
8. Total
9. Small Multiples
10. Conditional Formatting
About Powerviz:
At Powerviz, we are committed to building advanced, powerful, intuitive, and user-friendly custom visuals for Power BI. Our feature-rich Power BI Custom visuals bring the "WOW" factor to your Power BI Reports. Boost user experience and adoption while significantly reducing coding efforts and improving time to market.
📢 Stay updated with our latest developments:
⌚ Timestamps:
00:00 - Introduction
00:43 - Getting Heatmap from Appsource
01:01 - Adding data to Heatmap
01:18 - Advanced settings of Heatmap
01:24 - Shapes
05:14 - Data Colors
06:33 - Data Labels
08:26 - Axis Settings
09:36 - Grid Lines
10:22 - Sorting
10:50 - Plot Area
11:22 - Reference Line
13:34 - Ranking
14:19 - Totals
15:44 - Small Multiples
16:20 - Conditional Formatting
16:53 - Show Condition
17:47 - Lasso & Reverse Lasso
18:07 - Grid View
18:12 - Additional Features
19:07 - outro
 0:19:41
Heatmap (Step by Step Tutorial)
 0:07:41
Creating a WiFi Heatmap: A Step-by-Step Guide
 0:07:30
How to interpret a heatmap for differential gene expression analysis - simply explained!
 0:05:55
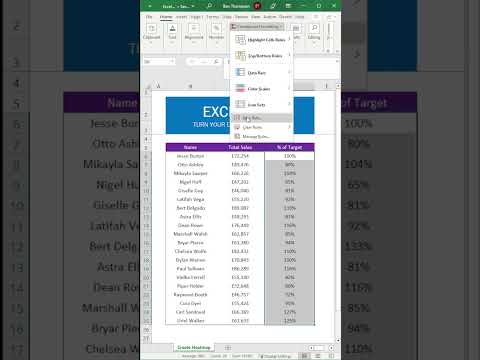
Create a Heat Map in Excel
 0:10:03
How to Create a Heat Map with Excel
 0:08:28
Seaborn Heatmap - How to Visualise Correlations and Data With Heatmaps in Python
 0:01:15
The Two-Step Heatmap Analysis to Increase Website Revenue
 0:13:34
SIM heatmap -Step by Step Guide
 2:46:42
Bitcoin (BTC) LIVE | Advanced Real-Time Liquidations Heatmap
 0:08:10
R Beginners: Creating a Stunning Hexbin Heatmap of USA - Step-by-Step Guide!
 0:24:57
Step-by-step heatmap tutorial in R with pheatmap()
 0:01:09
How to Create a Heatmap Effect in Canva | Step-by-Step Tutorial
 0:03:00
How to Create Heatmap Charts in PHP |Data from Excel or MySQL|A Trading Heatmap Explained in 3 min
 0:09:43
Heatmap in R (3 Examples) | Base R, ggplot2 & plotly Package | How to Create Heatmaps
 0:04:33
Creating a Heatmap in QGIS - Heatmap Tutorial
 0:06:11
Grainy Gradient Heatmap Photoshop Tutorial
 0:08:58
Make a simple heatmap of differentially expressed genes in R
 0:00:33
How to make a heatmap in Excel! #exceltips #tutorial
 0:15:23
Power BI Tutorial For Beginners + Create Heatmap From Scratch + Free PBIX
 0:10:00
How to generate a Heatmap in Python ?
 0:13:15
Make a Heatmap on R Studio
 0:00:15
heatmap in Rstudio #coding
 0:00:15
🔥3 Heatmap website you need to know for UX 🔥
 0:02:40
How to create a heatmap for your website?
Комментарии