filmov
tv
TI-84 Plus Graphing Calculator Guide: Graphing functions

Показать описание
You can jump to a specific topic by clicking one of the links below:
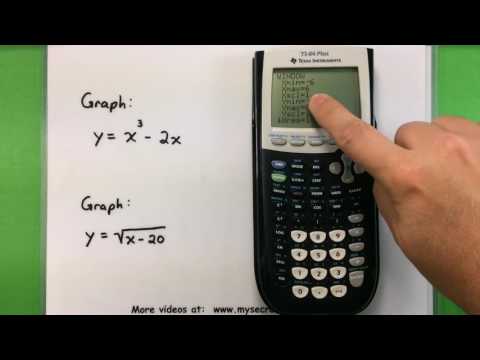
Graphing a function: 0:22
Zoom: 2:26
y-intercept and x-intercept: 3:29
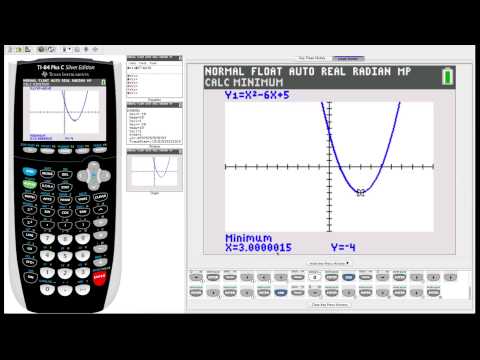
Minimum and Maximum values: 6:10
Intersection of graphs: 7:35
Parametric and Polar coordinates: 9:33
This is Tom from the Worldwide Center of Mathematics walking you through important and useful features of your TI-84 graphing calculator.
This TI-84 plus graphing calculator series is meant to be an instructional walkthrough that covers some of the most often used functions on a TI-84. This particular video covers graphing and shows the viewer how to graph functions, use the zoom feature and to find the intersection of two graphs. The software used in this video is TI-Smartview.
 0:11:48
TI-84 Plus Graphing Calculator Guide: Graphing functions
 0:05:57
Introducing the TI 84 Plus CE - Getting Started Series
 0:02:42
Graphing Basics With the TI-84 Plus CE: Graphing a Function, Locating Points and the TRACE Feature
 0:11:31
TI-84 Plus Graphing Calculator Guide: Statistics
 0:06:49
How To Graph on the TI-84 Plus CE
 0:00:24
Solve Matrix - Manual for TI-84 Plus CE Graphing Calculator
 0:06:30
Basic Math - Graphing with a Ti-83 or Ti-84 Calculator
 0:30:07
Calculator Tutorial - Intro to the TI 84 Plus
 0:04:35
TI-84 Plus Graphing Calculator Guide: Calculus
 0:00:35
TI-84 Tips and Tricks: Finding a Maximum on the Graph
 0:00:57
Best Graphing Calculator for Calculus Classes - TI-84 Plus CE #math #mathematics #maths
 0:05:59
Getting Started With the TI-84 Plus CE
 0:34:08
TI-84 Plus Calculator Basic Features - Lesson 1
 0:00:25
TI-84 Plus Tip: How to Solve Systems of Equations
 0:00:14
How to type a fraction fast on your TI-84 Plus CE
 0:12:53
SAT® Calculator Hacks: TI-84 Tips & Tricks
 0:00:25
TI-84 Tips and Tricks: Fractions!!!!
 0:08:09
TI-84 Plus Graphing Calculator Guide: Probability
 0:07:52
TI-84 Plus Graphing Calculator Guide: Fun and Useful Features
 0:01:00
TI 84 - How to graph on your GDC
 0:04:39
Basic Statistics on the TI-84 Plus CE: Getting Started Series
 1:08:51
Calculator Tutorial - Intro to the TI-84 Plus CE!
 0:08:25
TI-84 Plus Graphing Calculator Guide: Matrices
 0:00:26
TI-84 Plus Tips and Tricks: Mathprint vs. Classic Modes #calculator #ti84 #hacks #tips #howto #maths
Комментарии