filmov
tv
Create a netCDF Dataset with Python (netCDF4)

Показать описание
Demonstration of how to create a netCDF file from scratch with Python using the netCDF package. This tutorial covers how to create a new netCDF file, assign dimensions, create variables, and add data to variables. The new file is viewed in QGIS.
Create a netCDF Dataset with Python (netCDF4)
 0:06:27
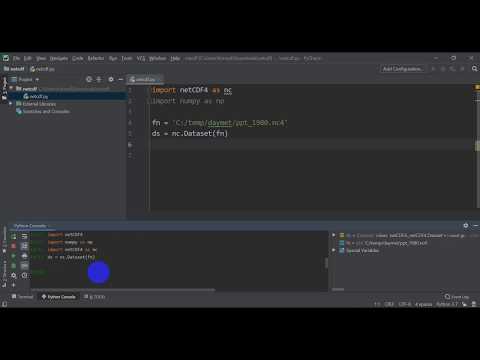
Create a netcdf dataset with python netcdf4
 0:03:30
How to use databridge to make NetCDF files
 0:29:04
How to create a NetCDF file using Python xarray for beginners - a depth profile
 0:32:37
How to create a NetCDF-CF file using Python xarray for beginngers - multiple dimensions
 0:06:13
Excel templates for NetCDF files
 0:13:55
Intro to netCDF with Python (netCDF4)
 0:13:07
Extracting Data from netCDF files using QGIS and ArcGIS
 0:14:54
How to get data out of a NetCDF file using Python: depth profile
 0:00:59
Extract data from a NetCDF File
 0:02:38
How to Make NetCDF Raster Layer and Extract Region of Interest in ArcMap
 0:07:42
The Beauty of NetCDF
 0:05:26
Create Multidimensional Raster Data Using a Single netCDF , GRIB, or HDF File
 0:06:20
Create Multidimensional Raster Data from Multiple NetCDF, GRIB, or HDF Files
 0:37:30
Python: How To Make Time Series From NETCDF Files
 0:02:40
Climate Data: Create netcdf raster layer
 0:15:35
Accessing NetCDF and GRIB file collections as cloud-native virtual datasets using Kerchunk
 0:02:27
How to open NetCDF .nc files in ArcGIS
 0:39:56
Visualising data in NetCDF format
 0:28:50
Reading NetCDF (.nc) data with Xarray in Python | For beginners | Python | Xarray| Jupyter notebook
 0:45:37
How to create a NetCDF file & CF and ACDD conventions | FAIR compliant
 0:13:07
Python for atmospheric science tutorial part 6 (reading, plotting, animating netcdf data)
 0:42:23
Input/Output and Middleware Tutorial: An introduction to NetCDF
 1:16:33
NetCDF Why and How: Creating Publication Quality NetCDF Datasets
Комментарии