filmov
tv
How to Analyze a DFD to Expose Missing Data Elements
Показать описание
DESCRIPTION (lectures 15 - 16)
Early detection and avoidance of data discrepancies, inconsistencies, and conflicts greatly reduces the risk of IT project overruns and failures. These lectures present a technique for ensuring that individual processes on a Data Flow Diagram get all of the data they need and no more, which leads to leaner, more stable IT applications that are reactive to the ever-evolving business environment.
Lectures 15 - 16 answer questions like:
1. How can I use a DFD to find missing data?
2. What questions do I need to ask?
3. What are the risks of skipping this step?
TRANSCRIPT (excerpt)
Hello, I’m Tom Hathaway. I’m wearing my BA hat to symbolize that anyone in an organization might do business analysis, whether or not they have the job title “Business Analyst”, so let’s talk business analysis. This KnowledgeKnugget™ introduces a technique for using a Data Flow Diagram (DFD) to find missing data elements. It explains what questions to ask and what risks this technique mitigates. This simple technique will help you when you are the one wearing the BA hat.
If you invest the time to create a data flow diagram (DFD), make sure that you are getting the most out of it. You can use the diagram to identify potentially missing data elements, redundant data, and possible data conflicts. We would like to introduce a technique called ‘Horizontal Balancing’ or the ‘Preservation of Data’ law. The technique can be very useful for identifying data discrepancies, inconsistencies, and conflicts which are three major contributors to IT project overruns and failures.
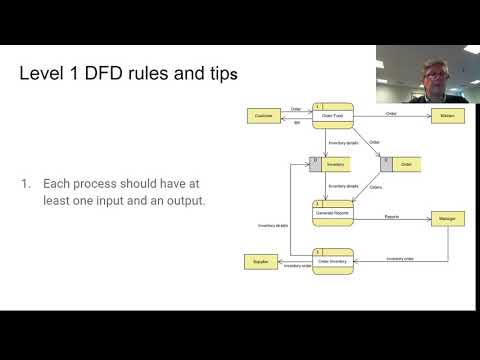
Based on the rules governing DFDs, a process has to transform data, meaning the data it produces has to be different than the data it consumes. Logic dictates that the data coming out of a process can only come from two possible sources: either it comes directly via an incoming data flow OR the process creates it using the data it receives.
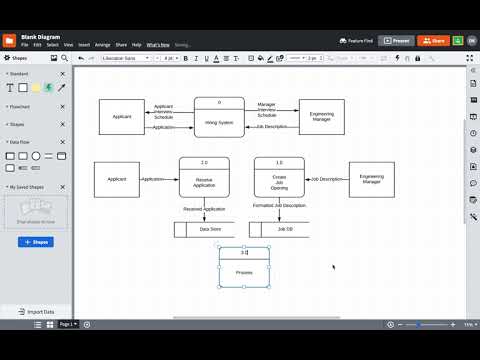
A data flow can come from a data store, another process, or an external entity. Processes need algorithms or business rules to create data. For example, the simple process Determine Age contains the algorithm Age = Current Year (from today’s date) – Birth Year (from the Employee’s Date of Birth). Algorithms and business rules in turn need data (getting the Birth Year requires an Employee ID to select the appropriate employee) which has to either come into the process from an incoming data flow or itself be created by a different algorithm or business rule. In the end, you should account for every data element the process creates and every data element it needs to create the output.
…
ABOUT THE ECOURSE
• What is a Data Flow Diagram (DFD) and what does it do for you?
• What is the difference between a Rigorous Physical Process Model and a Context-Level DFD?
• What symbols can you use on each type of diagram?
• What is the business value of exploding or levelling a DFD?
• What is a simple approach for drilling down into a process?
• How can you show the internal processes and flows that produce the results?
• What does balancing a Data Flow Diagram mean and what is the business value?
• What is the most efficient approach to balancing a DFD?
• What business value do detailed process specifications offer?
• How can you express detailed specifications for processes and data?
• What is “metadata" and why do you need it?
• What does a fully balanced DFD look like?
• What value does a DFD fragment provide?
 0:04:14
 0:08:09
 0:12:06
 0:05:38
 0:08:16
 0:37:56
 0:24:20
 0:05:56
 0:04:50
 0:11:01
 0:04:33
 0:05:45
 0:10:58
 0:19:11
 0:00:05
 0:33:34
 0:03:12
 0:50:10
 0:02:50
 0:04:36
 0:15:55
 0:03:04
 0:01:05