filmov
tv
Mapping & Analyzing canopy height using Global CHM dataset in Google Earth Engine
Показать описание
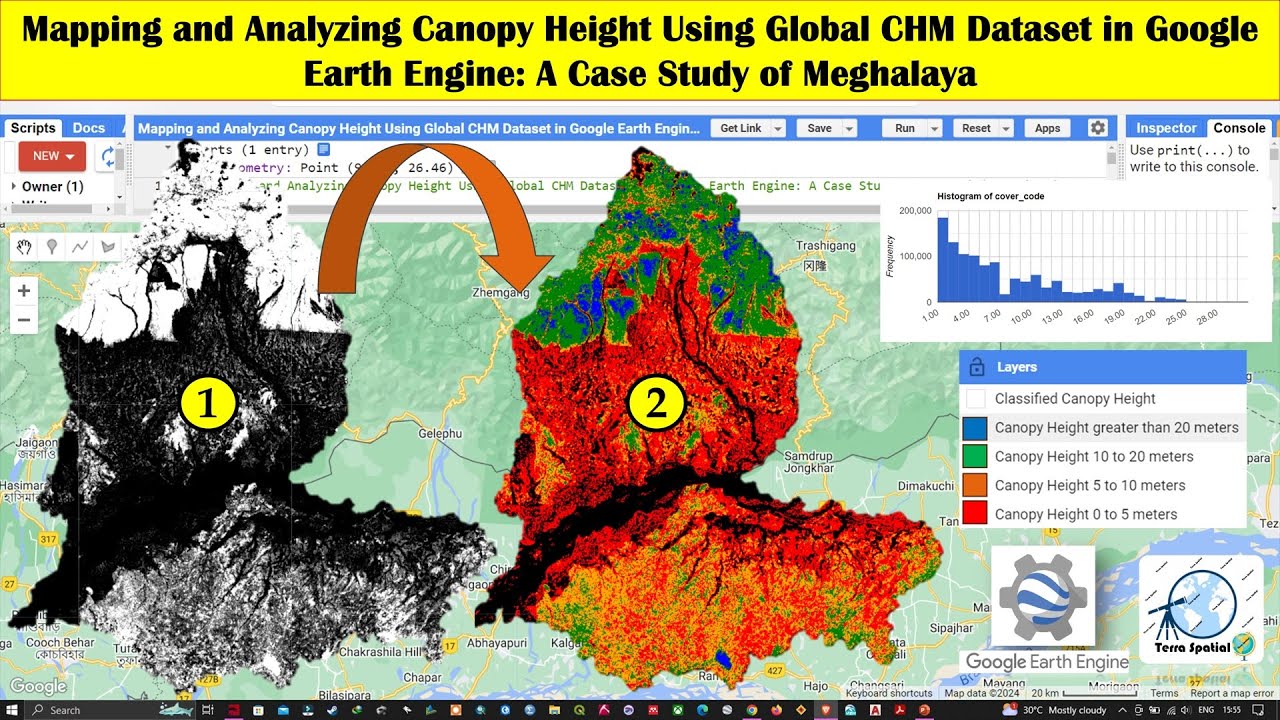
In this video, we take you through an exciting journey of mapping and analyzing canopy height using the Global Canopy Height Model (CHM) dataset in Google Earth Engine, focusing on a specific region in Meghalaya. Canopy height is a crucial measurement in forestry, ecology, and environmental studies, representing the height of trees above the ground topography. The CHM dataset, derived from high-resolution LIDAR data, maps tree height as a continuous surface, providing detailed insights into forest structure.
We start by loading the HydroBASINS level 6 dataset to define our region of interest (ROI) and add it to our map for visualization. We then filter the basin collection to focus on a specific ROI containing our point of interest, center the map, and visualize the study area. Next, we load the canopy height image collection and create a mosaic to visualize canopy height data. We define visualization parameters, clip the canopy height image to the ROI, and add it to the map. We also create a mask for forest areas with canopy height greater than 0, update the mask, and visualize these forest areas.
To understand the canopy height distribution, we display a histogram of canopy height values within the ROI and calculate the mean, maximum, minimum, and 99th percentile canopy heights. This data provides a comprehensive overview of forest structure in the region. We further classify the forest areas into four classes based on canopy height: 0 to 5 meters, 5 to 10 meters, 10 to 20 meters, and greater than 20 meters. The classified image is visualized on the map with a color palette for better interpretation.
Finally, we demonstrate how to export the classified canopy height image to Google Drive, making it easy to share and use in further analyses. This code and methodology have wide applications in forest management, biodiversity studies, carbon stock estimation, land use planning, and disaster management. It helps in identifying areas with different canopy heights, monitoring changes over time, estimating biomass, and supporting sustainable forest management practices.
-----------------------------------------------------------------
Code link:
Resources:
-----------------------------------------------------------------
Join us in this detailed exploration of canopy height mapping using Google Earth Engine to enhance your understanding and application of remote sensing data in environmental studies. Don’t forget to like, share, and subscribe for more insightful videos!
-----------------------------------------------------------------
💰🤝🏻Join Membership to get access to perks & Support us🤝🏻💰
-----------------------------------------------------------------
👩💻 Join the Terra Spatial Community:
Engage with fellow learners, share your experiences, and get support on our dedicated community forum.
🌐 Stay connected:
---------------------------------------------------------------
👍 **Don't forget to Like, Share, and Subscribe for more insightful tutorials! 🌐✨
#CanopyHeight #googleearthengine #remotesensing #forestry #ecology #environmentalscience #meghalaya #lidar #forestmanagement #biodiversity #CarbonStock #LandUsePlanning #disastermanagement
 0:37:14
Mapping & Analyzing canopy height using Global CHM dataset in Google Earth Engine
 0:13:22
Mapping & Analyzing Canopy Height Using Global CHM Dataset in Google Earth Engine
 0:13:38
Tree Canopy Analysis in MapInfo Pro
 0:19:47
Canopy Height Measurement using Spaceborne LiDAR
 0:23:34
FOREST CANOPY HEIGHT ESTIMATION & TREE COVER ESTIMATION
 0:09:10
Tree Heights from Lidar with QGIS (Create a Canopy Height Model)
 0:36:03
Google Earth Engine Tutorial-36: Global Canopy Height Product (1-meter)
 0:18:36
Global canopy height mapping with deep learning (Bayesian deep learning) | DS Meetup
 0:04:58
Using LIDAR to Map Percent Forest Canopy Closure
 0:12:10
Part2, How to calculate Canopy height model | Canopy height model with Lidar
 0:14:06
Locating forest interior habitat using LiDAR-derived canopy height model
 0:42:52
Dr. Hao Tang | Mapping global canopy cover and vertical profile metrics using spaceborne lidar
 0:42:52
Dr Hao Tang | Mapping global canopy cover and vertical profile metrics using spaceborne lidar
 0:14:42
Undergraduate Project: Comparison between IFSAR Data and UAV Image for Forest Canopy Height Mapping
 0:06:33
Canopy height
 0:21:11
How to measure canopy height and volume using QGIS (Drones in Agriculture series, 6/7)
 0:44:42
Explainable Geospatial Machine Learning for Modeling Forest Canopy Height
 0:14:31
Modeling Forest Canopy Height using EO Data and GEE
 0:07:49
FOR 242 Week 7 Part 1: Generating canopy height model from NOAA Digital Coast LiDAR datasets
 0:03:10
How to create a Canopy Height Model (CHM) using Global Mapper
 0:06:27
FIELDimageR: Estimate plant height using the canopy height model (CHM) - Software R
 0:05:16
High Resolution 1m Global Canopy Height Maps using Google Earth Engine || Canopy Height Map
 0:15:34
Basics of Using LiDAR Data, Lecture 3
 0:08:45
Vegetation Forest Canopy Cover Estimation Using LIDAR/Photogrammetric Point Clouds Data and ArcGIS
Комментарии