filmov
tv
Martin Krzywinski - The Art of Data Visualization, Design & Information Mapping

Показать описание
--
Krzywinski built the Center’s first IT system, beefed up their security, designed optimized keyboard layouts, and generally geeked out. Along the way, he started helping researchers with their projects, getting to know their data and its possibilities. The rest is design history.
Falling DNA sequencing prices and a growing appreciation of cellular complexity soon unleashed a torrent of genetic data. The tools for gathering data, though, had outpaced those for portraying it. “I was frustrated, reading a lot of the scientific papers and not understanding what they were saying. I just wanted them to be simpler,” said Krzywinski. “There’s nothing I can do to make biology simpler, but I started telling people to make clearer figures.”
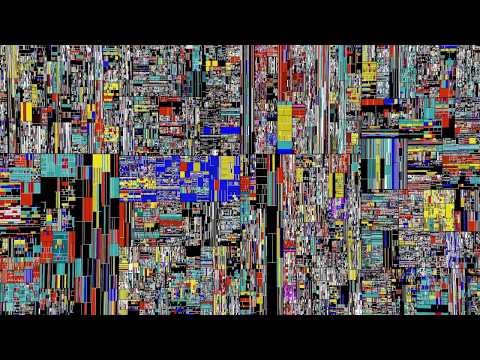
To do this, Krzywinski developed Circos, an open source visualization tool that arranges tabular data in circular form. It was a simple idea, but transformative: It’s since been used for thousands of visualizations, and its distinctive aesthetic is synonymous with the informational richness of our moment.
---
Martin Krzywinski is a scientist who specializes in bioinformatics—the practice of organizing vast sets of biological data and representing them graphically for research and analysis. His work focuses on cancer research, which he performs at the BC Cancer Agency in Vancouver.
 0:20:51
Martin Krzywinski - The Art of Data Visualization, Design & Information Mapping
 0:00:20
Martin Krzywinski - Pi
 0:07:30
Max Cooper - Transcendental Tree Map (Official video by Martin Krzywinski and Nick Cobby)
 0:35:12
SPP Cambridge 2019: Martin Krzywinski (British Columbia Cancer Agency) - 'Art is Science in Lov...
 0:39:01
What does Art have to do with Science?
 0:53:50
VIZBI 2013: Visual Design principles - Martin Krzywinski
 0:07:53
Pi Day: Artist Martin Krzywinski & Making Pi Pies
 0:05:55
Max Cooper - Ascent - Official video by Martin Krzywinski
 0:37:48
Data Visualization with Martin Krzywinski / 31.10.2018 @Ankara University Faculty of Communication
 0:05:56
Free the Data Project: Human Genome Art By Humans With Genomes
 0:00:16
Meaning in disorder - Digits of pi in a tree map with Nick Cobby and Martin Krzywinski
 0:11:16
Martin Krzywinski - Pi
 0:04:31
Connection Between Data Visualization, Art and Data Art
 0:02:05
Max Cooper - Transcendence by Max Cooper, Salvador Breed and Martin Krzywinski
 0:00:09
‘Enter 2022’ by Ksawery Kirklewski
 0:06:35
Max Cooper - Aleph 2 (Official Video by Martin Krzywinski)
 0:01:28
Dimensions and Transcendence — WIP samples — 001
 0:04:30
Pi Day 2022 | Discussing the score of three one four: a number of notes | Introduction to the Album
 0:01:49
Pi Day 2022 | Discussing the score of three one four: a number of notes | Meet the composer
 0:11:47
ReForm | Data Becomes Art in Immersive Visualizations
 1:32:22
ETC Webinar Series: The Essence of Data Visualization - How to Create Effective Figures of Your Data
 0:03:34
Pi Day 2022 | three one four: a number of notes | Track 2 | Feynman Point
 2:03:20
Dimensions and Transcendence — 2 hour mix — color
 0:02:00
Dimensions and Transcendence — WIP samples — 004
Комментарии