filmov
tv
Trendline Mastery - How To Identify Momentum Change

Показать описание
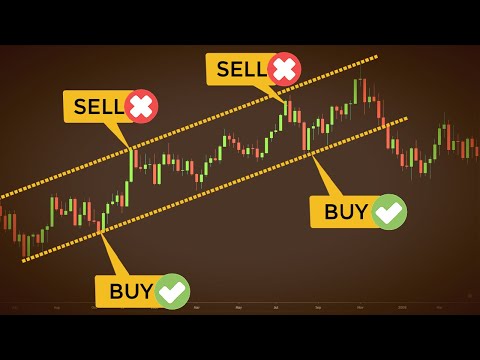
Trendlines are a tool that help a trader to find a high probability setup. According to price action rules, after price breaks the trendline, attempt to create a new extreme in the previous trend's direction.
Overshoot happens in the direction of a trend. Overshoot indicates oversold or overbought market condition. During this stage price will most often than not break the trendline or even reverse the entire trend. Therefore traders should avoid taking trades of trendline as it may be just a trap in the middle of reversal.
This video highlights one of the best scalping strategies that can be used in day trading. Whether you are trading forex, crypto or indices, this Scalping strategy will work incredibly well. This Scalping Strategy also works on any time frame and can turn into long term position holding.
Price action describes the characteristics of a security’s price movements. This movement is quite often analyzed with respect to price changes in the recent past. In simple terms, price action is a trading technique that allows a trader to read the market and make subjective trading decisions based on the recent and actual price movements, rather than relying solely on technical indicators.
The only people who know where the market is heading are institutions. They are the ones who make the market move and our job as a retail traders is to follow their footsteps and get the piece of their movement. As a price action traders we need to find the most profitable ways to enter trades. The highest probability setups are 2nd entries at the key entry points.
2000 tick chart
S&P 500 ES Futures
21 bar EMA
Date August 5 2022
If you want more Advanced Trading Tips, Strategies and Trading Community.
Looking for a funding company? Try
Use Coupon Code for 80% discount! - RXBKISKT
 0:17:44
Trendline Mastery - How To Identify Momentum Change
 0:58:34
MASTERY OF TRENDLINE STRATEGY
 0:12:16
Trendline Trading Master Guide!! Best Strategies
 0:13:54
TRENDLINE FULL MASTERY COURSE
 0:44:13
TRENDLINE TRADING COURSE | With Live Examples + Secrets
 1:35:31
Trend Line Mastery
 0:04:33
TRENDLINE MASTERY
 0:08:38
2 Best Trendline Trading Strategy | Stock Dictionary
 0:50:24
Full Trendline Chart Analysis
 0:12:14
Simple trendline strategy to make you millions with low risk in forex trading #forex
 0:18:26
Eman Trades Trendline Mastery - How To Identify Momentum Change with Thomas Wade
 0:09:21
Trendline Mastery: Unlock Profitable Trading with Fundamentals! 📈💸
 0:30:03
Trendline Mastery
 0:09:27
I STARTED WINNING MORE AFTER I MASTERED THIS TRADING CONCEPT
 0:09:07
'Pro Trading Demystified: Open secret of Triple Candlestick and Trendline Mastery
 0:23:11
Trendline Trading Secrets + 3 trendline strategies
 0:11:31
Trading Trendlines & Channels In Forex & Stock Market (Price Action Strategies)
 0:00:08
Trendline Trading Mastery 📈 | Forex Secrets 💰 | #daytrading #TradingTips #scalping 🚀
 0:12:23
The ONLY Trendline Strategy You Will Need
 0:09:30
Unlock Trendline Breakout Mastery: Essential Techniques for Successful Trading!
 0:00:51
Price Action Mastery: How I Identified a Trend Line and Made a Profitable Trade #forex #stockmarket
 0:15:41
Trend Line Mastery Using Cycle Based Trend Lines!!
 0:34:22
MY MILLION DOLLAR FOREX TRADING STRATEGY [ REVEALED] - Trader Talk Episode 36
 0:32:40
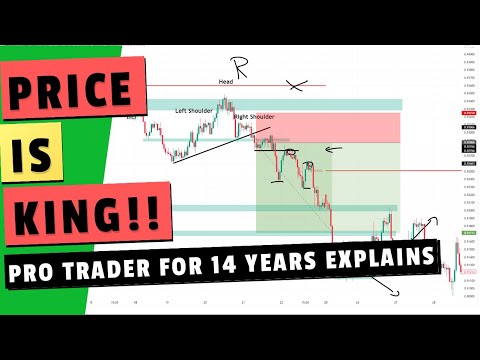
Price Action Trading like a Pro - I share my best tips after 14 years
Комментарии