filmov
tv
Solving Data Interpretation Problems- Tricks, Techniques, Visualization and Imagination

Показать описание
Dr. Manishika Jain in this video focuses on solving data interpretation problems mainly finding way out for approximations, solving bar graphs, tables and pie charts by imagination and visualization.
Chapters:
0:00 Introduction: Solving Data Interpretation Problems- Tricks, Techniques, Visualization and Imagination
0:38 Types of Questions
0:59 Themes for Trick Analysis
3:11 Doing Approximation – Game of Zero’s
10:45 Don’t Simplify Fractions – Until Necessary
14:11 Average
15:56 Pie Diagram
#Tricks #Imagination #Fractions #Necessary #Interpretation #Approximation #Scatter #Visualization #Manishika #Examrace
Examrace is number 1 education portal for competitive and scholastic exam like UPSC, NET, SSC, Bank PO, IBPS, NEET, AIIMS, JEE and more. We provide free study material, exam & sample papers, information on deadlines, exam format etc. Our vision is to provide preparation resources to each and every student even in distant corders of the globe.
data interpretation techniques
data interpretation basics
data interpretation pie chart
data interpretation youtube
data interpretation books
data interpretation test
data interpretation for ugc net
data interpretation infosys
 0:05:15
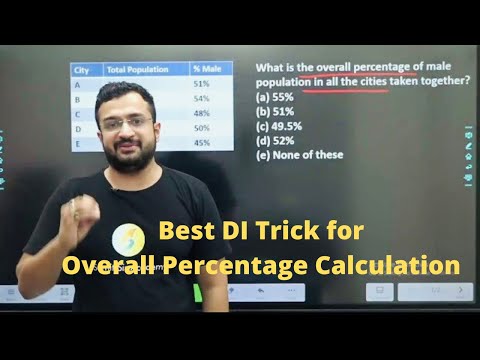
Data Interpretation | Best DI Trick for Overall Percentage Calculation | Maths | Sumit Verma
 0:09:40
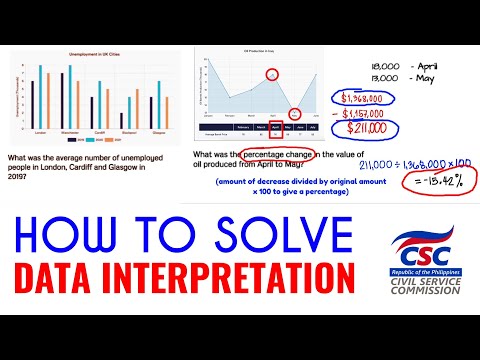
How to solve data interpretation problems
 0:06:11
Solving Data Interpretation Questions
 0:10:05
Numerical Reasoning Tests (Data Interpretation) Questions and Answers
 0:21:24
GRE Data Interpretation 101 | The Best Tips & Tricks
 0:24:54
Solving Data Interpretation Problems- Tricks, Techniques, Visualization and Imagination
 0:30:06
DATA INTERPRETATION BEST TRICKS 5 MARKS IN JUST 2 MIN | SBI CLERK | RRB PO&CLERK | IBPS PO&...
 0:00:46
Tricks to solve Data Interpretation Questions
 0:13:34
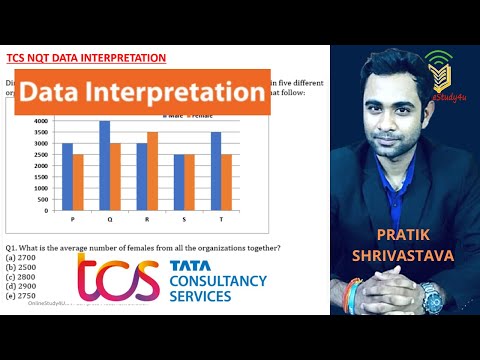
TCS NQT Data Interpretation Questions | Solve Data Interpreation Question in Mind
 0:00:30
Quadratic Equation Shortcut Trick | Solve Equation in 5 Seconds
 0:10:10
Data Interpretation | Best DI Trick for Double Pie Chart | Maths | Sumit Verma
 0:19:49
DATA INTERPRETATION #1 ( IBPS/CAT/RRB/PAYMENT BANKS...)
 4:08:21
Data Interpretation Shortcut Techniques | All Graphs in one Session with Concepts & Tricks | Kau...
 0:00:36
Profit and Loss Short Trick in Hindi | UPSSC PET, SSC GD, RRB NTPC GROUP D , Percentage kaise nikale
 0:09:03
Tricks to solve data interpretation | How to solve data interpretation problems quickly
 0:00:36
Analogy | Number Analogy | Reasoning Classes| SSC CGL Reasoning | RRB NTPC Missing Number || #shorts
 0:02:38
Short Tricks to Solve Data Interpretation Questions - SBI Bank PO exam
 0:00:50
Time & Work Trick | Important Maths Trick by Neeraj Sir
 0:10:13
7 Best Tips and Tricks To Solve Data Interpretation Questions (Problems) Quickly in NTA UGC NET Exam
 1:02:52
Data Interpretation ( Complete Concept & Question ) By Gagan Pratap sir
 0:00:57
Find Missing Number | Reasoning Missing Question | Reasoning Trick for SSC CGL, GROUPD, RRB NTPC
 0:00:45
Easy Trick to Solve DI Data Interpretation #DI #maths #ugcnetmaths #mathstricks #howtosolvedi
 0:00:49
Data Interpretation Important Questions | Aptitude Tricks | Easy to solve
 4:28:07
🔥Elevate Your DI Skills for Fast Solving | Most Expected Data Interpretation for RRB PO & Clerk ...
Комментарии